The Rocket Equation and Why Staging Wins
After reading this you will be able to compute the delta-v of any rocket stage from its masses, predict whether a design clears low Earth orbit, and understand why gravity and drag steal a kilometer or two per second from your budget.
What the lab actually computes
Give the Rocket Designer & Staging Lab a stack of engines, tanks and a payload, and it answers two questions. First, on paper: how much velocity change (delta-v) can each stage deliver, and does the total clear a known target? Second, in flight: launch the design and integrate its ascent through real gravity and air, watching altitude and speed climb while stages fall away.
Here is the hook. A single-stage rocket with a fantastic mass ratio, say 90% propellant, produces about 4.2 \cdot 9.81 \cdot \ln(10) \approx 9.5 km/s of vacuum delta-v with a good kerosene engine. Low Earth orbit needs roughly 9.4 km/s once you add gravity and drag losses. On paper it just barely qualifies. In practice it fails, because no real tank is 90% propellant by mass and because losses eat more than the paper budget suggests. Split the same propellant into two stages and the numbers change completely. That gap is the whole story of orbital flight.
When this model helps and when it misleads
Use the lab to build intuition about mass ratios, staging and the shape of an ascent. It reproduces the physics that dominates: the exponential rocket equation, thrust-to-weight limits, gravity losses and drag losses. If you want to feel why the second stage matters more than the first, or why adding fuel eventually stops helping, this is the right place.
Do not treat it as a flight-qualified trajectory optimizer. It assumes a fixed gravity-turn profile, a simple exponential atmosphere, a spherical non-rotating Earth and constant specific impulse per stage. Real vehicles throttle, gimbal, fly loft profiles, and gain about 0.4 km/s free from Earth's rotation at the equator. Those effects shift numbers by hundreds of m/s. The trends are honest; the third decimal place is not.
For what happens after you reach orbit, the Orbital Mission Planner takes over: it scans launch windows and flies interplanetary transfers on a porkchop plot.
The Tsiolkovsky rocket equation
Everything starts from one equation, derived from conservation of momentum as a rocket throws mass backward:
Here \Delta v is the velocity change the stage can produce in a vacuum with no losses, in m/s. I_{sp} is specific impulse in seconds, a measure of engine efficiency: how many seconds one kilogram of propellant produces one kilogram-force of thrust. g_0 = 9.81 m/s² converts that to real units. m_0 is the mass at ignition (structure plus propellant plus everything above), and m_1 is the mass after the propellant is spent.
The ratio m_0 / m_1 is the mass ratio, and the logarithm is where the pain lives. To double your delta-v you must square the mass ratio, not double it. A stage with mass ratio 3 gives \ln(3) \approx 1.099 times I_{sp} \cdot g_0. To get twice that you need mass ratio 9, meaning eight times as much propellant per unit of dry mass. That diminishing return is why you cannot simply bolt on more fuel.
A worked example with the demo rocket
The demo button loads a two-stage vehicle. Work the numbers by hand and the lab should match them before losses. Assume a first stage with 400 t of propellant and 25 t of dry structure, a second stage with 90 t of propellant and 10 t of dry structure, and a 5 t payload on top.
Delta-v of each stage, then the total
- First-stage ignition mass m_0 is everything:
400 + 25 + 90 + 10 + 5 = 530t. After its propellant burns, m_1 = 530 - 400 = 130 t. Mass ratio 530/130 = 4.077. - With a sea-to-vacuum I_{sp} of about 300 s, first-stage delta-v is 300 \cdot 9.81 \cdot \ln(4.077) = 2943 \cdot 1.406 \approx 4137 m/s.
- Drop the empty first stage (25 t gone). Second-stage ignition mass is
90 + 10 + 5 = 105t. After burn, m_1 = 105 - 90 = 15 t. Mass ratio 105/15 = 7.0. - A vacuum-optimized second stage with I_{sp} = 340 s gives 340 \cdot 9.81 \cdot \ln(7.0) = 3335 \cdot 1.946 \approx 6491 m/s.
- Total vacuum delta-v: 4137 + 6491 \approx 10628 m/s.
That paper total of 10.6 km/s sits comfortably above the 9.4 km/s LEO line. The margin is real but not huge: it is the buffer that pays for gravity and drag losses during the actual climb.
Reading the ascent plots
When you launch, the lab integrates the trajectory in small time steps. At each step it computes thrust, weight and drag, updates acceleration, then velocity, then position. Three curves come out: altitude, velocity and acceleration versus time.
Watch acceleration. It rises during a burn because the rocket keeps thrusting while getting lighter (constant thrust, falling mass). Then it drops sharply to near zero at staging, spikes back up when the next engine lights, and jumps again each time you shed dead mass. Those sawtooth steps are the visible signature of the mass ratio at work.
Related tools
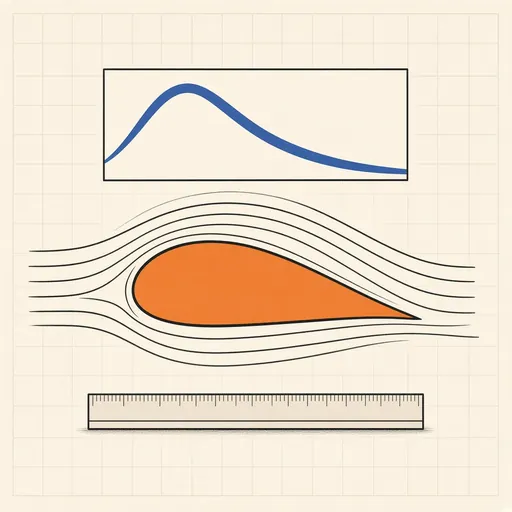
Airfoil Designer & Analyzer
Shape a NACA airfoil, see its pressure distribution and plot lift and drag polars, XFOIL-style, in the browser.
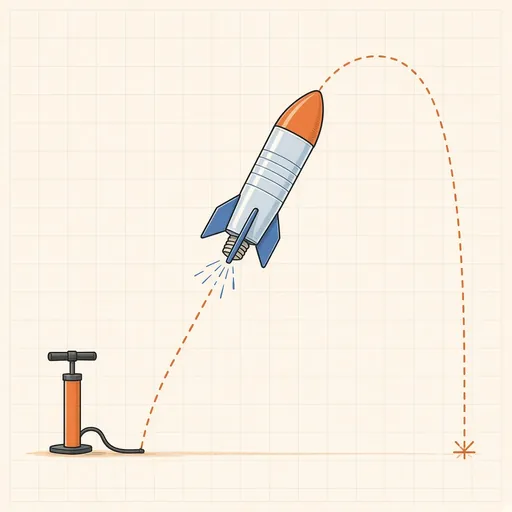
Bottle Rocket Simulator
Fill a soda-bottle water rocket, pump it up and launch it: find the water level, pressure and fins that fly highest.
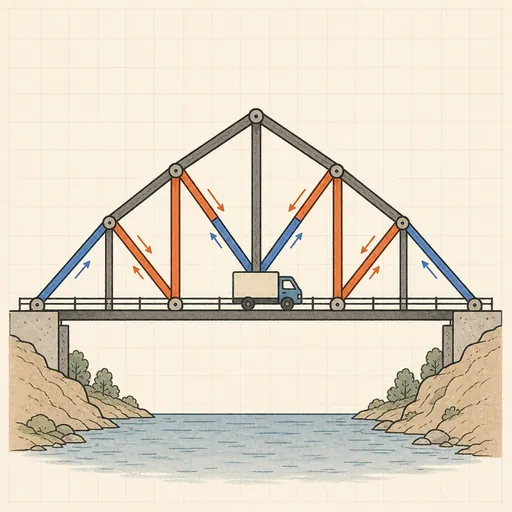
Bridge Builder & Truss Simulator
Design a truss bridge, send a truck across and watch every member strain, buckle or snap under load.
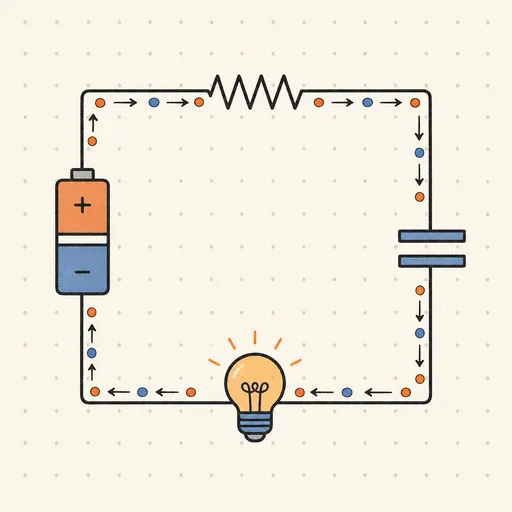
Circuit Simulator
Build analog circuits on a grid and watch current flow live — batteries, resistors, capacitors, LEDs and more.
Earthquake Shake Table Simulator
Shake a multi-story building with an earthquake and watch it sway, crack or survive, with base isolation and dampers.
Gear Generator
Design involute spur gears, racks and planetary sets, watch them mesh and export SVG or DXF for laser cutting.