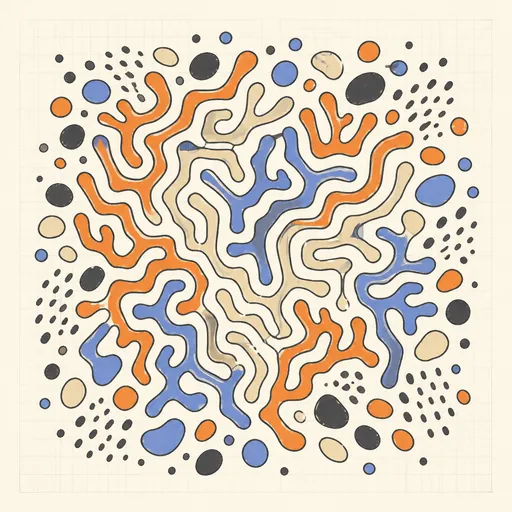
Reaction–Diffusion Patterns
Two chemicals live on every cell of a grid: U is fed in everywhere at a feed rate, V consumes U to make more of itself (the autocatalytic step U + 2V → 3V) and is removed at a kill rate, and both spread by diffusion, U roughly twice as fast as V. That is the entire Gray–Scott model, yet sliding the two rates crosses a whole zoo of self-organizing patterns. Pick a preset — coral, mitosis, spots, zebra stripes, worms or waves — or explore with the fine feed and kill sliders while the field keeps running. Paint fresh V anywhere with the adjustable brush and watch the pattern heal, split or invade; reseed scatters new random starting squares. The field is drawn through a navy-to-teal-to-cream palette by V concentration, and any frame can be exported as PNG.
Runs 100% in your browser — simulations are computed locally on your device.
Read the full guide to this tool
Notes
- Alan Turing predicted in 1952 ("The chemical basis of morphogenesis") that two reacting, diffusing chemicals could break symmetry on their own and form stable spots and stripes — decades before such patterns were produced in a real chemical experiment.
- Update rules: ∂u/∂t = Dᵤ∇²u − uv² + f(1−u) and ∂v/∂t = Dᵥ∇²v + uv² − (f+k)v. The uv² term is the autocatalysis; the feed rate f and kill rate k select the pattern.
- Pearson mapped the f–k parameter plane in 1993 and found a dozen distinct regimes — self-replicating spots ("mitosis"), labyrinths, worms and travelling waves — all from the same two equations.
- Runs 100% in your browser — simulations are computed locally on your device.
Related tools
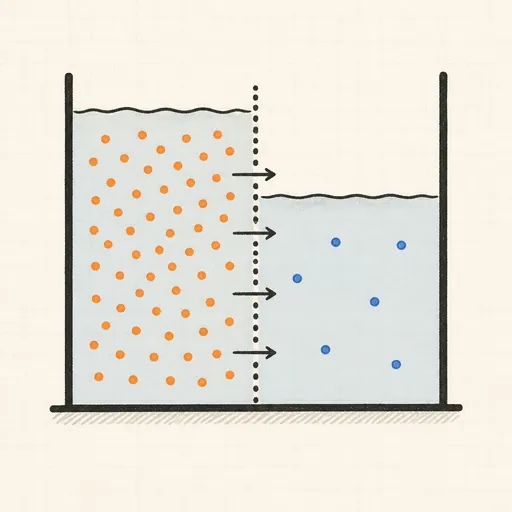
Diffusion & Osmosis
Split a tank with a semipermeable wall and watch particles diffuse and water flow to equalise concentration.
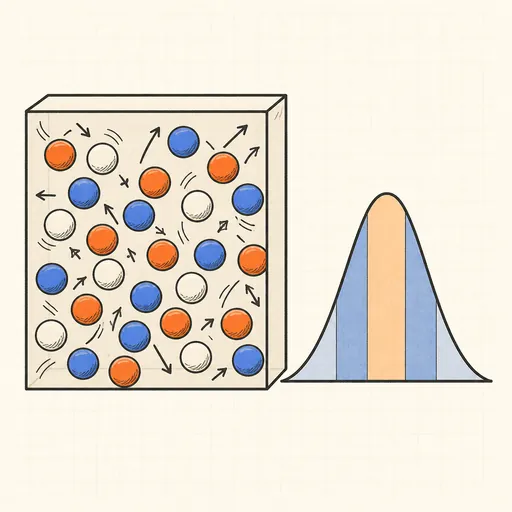
Ideal Gas & Maxwell–Boltzmann
Bounce hard-disc molecules in a box and watch their speeds settle into the Maxwell–Boltzmann distribution.
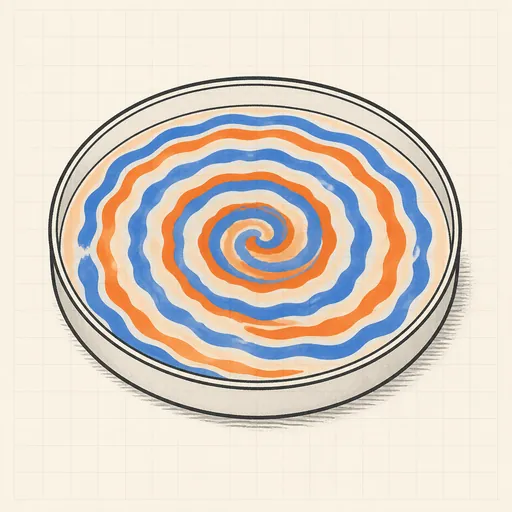
Belousov–Zhabotinsky Reaction
Watch an oscillating chemical medium organize itself into rotating spiral waves.
Crystal Growth Simulator
Grow branching fractal crystals one wandering particle at a time with diffusion-limited aggregation.
Flame Simulator
Paint fire and shape a living flame with fuel, cooling, wind and turbulence.
Ising Model Ferromagnet
Flip a grid of spins at any temperature and watch magnetic domains freeze in or melt at the critical point.