Molecular Dynamics: Phases of Matter
After reading this you will understand how a single pair force turns a box of atoms into a gas, a liquid or a crystal, and you will be able to reproduce the numbers the simulation shows on screen.
What the simulation actually does
The tool tracks a few hundred atoms in a flat square box. Every atom pushes and pulls on its neighbours through one rule, the Lennard-Jones potential, and Newton's second law moves them from that force. Nothing tells the atoms to freeze. Nothing draws a crystal. You only set a target temperature, and the collective behaviour follows.
Start hot, at a target temperature near 2.0 in reduced units, and the atoms fly apart into a structureless gas that fills the box uniformly. Cool to about 0.6 and they clump into round droplets with a sharp surface, the two-dimensional version of liquid water beading on glass. Cool further, below roughly 0.4, and the droplets lock into rafts where every interior atom has six neighbours arranged in a hexagon. That hexagonal packing is the densest way to tile a plane with disks, and the atoms find it on their own.
One force. Three phases. The transitions are not programmed; they emerge from the competition between attraction, repulsion and thermal jostling.
When this model helps and when it misleads
Use this simulation to build intuition about phase transitions, surface tension, latent heat and how order appears from a purely local rule. It is honest about the qualitative story: cooling really does drive condensation and freezing, and the crystal really is hexagonal because that geometry minimises the energy of the pair potential.
Do not read quantitative chemistry off the screen. This is a two-dimensional world, and real matter is three-dimensional. The numbers are in reduced units, not kelvin or joules. The box holds a few hundred atoms, not the 10^{23} of a real sample, so every measurement fluctuates and the phase boundaries are smeared rather than sharp. The Berendsen thermostat drags the kinetic energy toward your target, which is convenient but does not sample any exact statistical ensemble.
Two-dimensional freezing is genuinely different from three-dimensional freezing. The Mermin-Wagner theorem forbids true long-range positional order in 2D, and melting is predicted to pass through an intermediate hexatic phase (KTHNY theory). What you see as a "crystal" has orientational order and only short-range positional order. Do not carry conclusions from this box straight into a 3D claim.
The Lennard-Jones potential and its intuition
Every pair of atoms separated by distance r shares an energy given by the Lennard-Jones potential:
Here \varepsilon sets the depth of the energy well (how strongly atoms bind) and \sigma sets the distance where the energy crosses zero (roughly the atom's diameter). The r^{-12} term is a steep wall: push two atoms closer than \sigma and the energy shoots up, modelling the refusal of electron clouds to overlap. The r^{-6} term is a gentle pull, the van der Waals attraction that is physically correct for induced dipoles.
The force on an atom is the negative slope of this energy. Setting \varepsilon = 1 and \sigma = 1, the well bottom sits at r = 2^{1/6} \approx 1.122, where the energy reaches its minimum of -\varepsilon = -1. That spacing is exactly where atoms want to rest, and it is the lattice spacing of the crystal you will see.
How the atoms move: velocity Verlet
Given the forces, positions advance one small time step \Delta t at a time using the velocity-Verlet update:
Then the force is recomputed at the new position to get \vec{a}(t + \Delta t), and the velocity is updated with the average of the old and new accelerations. Here \vec{r} is position, \vec{v} velocity, \vec{a} acceleration (force divided by mass), and \Delta t the step size, typically 0.005 in reduced units.
This scheme is time-reversible and symplectic, so total energy stays near constant over long runs instead of drifting. To find neighbours cheaply the box is chopped into a grid of cells and each atom only checks atoms in its own and adjacent cells, so the cost grows linearly with the number of atoms rather than as its square.
A worked example using the demo defaults
From one target temperature to a reading on screen
Load the demo (field defaults) and hold the target temperature at T = 1.0 in reduced units. Temperature in a 2D simulation relates to the average kinetic energy per atom by the equipartition rule, one \tfrac{1}{2}k_BT for each of the two directions of motion. In reduced units where k_B = 1:
- Set T = 1.0. Each atom carries on average a kinetic energy of
1.0. - With N = 400 atoms the total kinetic energy is about 400 \times 1.0 = 400.
- The instantaneous temperature is read back as T_{\text{inst}} = \tfrac{1}{N}\sum \tfrac{1}{2}m v_i^2, which hovers around
1.0but fluctuates by roughly \pm 1/\sqrt{N} \approx \pm 0.05. - At this temperature the potential energy per atom settles near
-2.0in the liquid, because a typical interior atom sits in the wells of several neighbours. The screen readout should sit in that neighbourhood.
Now drag the target to T = 0.3. The kinetic energy per atom falls toward 0.3, atoms stop escaping the wells, and the potential energy per atom drops toward roughly -3.2 as each atom finds its six-neighbour hexagonal seat. That drop in potential energy is the latent heat of freezing, released as the crystal forms.
Reading the colours and the readouts
Atoms are coloured by kinetic energy: cold blue, white in the middle, hot orange for the fastest movers. In the gas the colours are mixed and shifting, because collisions constantly reshuffle speeds. In a droplet you often see a slightly hotter surface and a calmer core. In the crystal most atoms are pale blue and nearly still, with occasional orange flickers at defects where an atom has the wrong number of neighbours.
The two live numbers tell the real story. The instantaneous temperature confirms the thermostat is holding your target within fluctuations of about \pm 1/\sqrt{N}. The potential energy per atom is the phase indicator. Watch it as you cool: it falls smoothly through the gas, then drops more steeply as droplets condense, then drops again as the crystal forms. Each drop is energy released when atoms settle into new wells.
| Target T | Phase seen | KE per atom | PE per atom | Visual cue |
|---|---|---|---|---|
| 2.0 | Gas | 2.0 | -0.3 | uniform, colours mixing |
| 0.7 | Liquid | 0.7 | -2.4 | round droplets, sharp edge |
| 0.3 | Crystal | 0.3 | -3.2 | hexagonal rafts, pale blue |
Common mistakes when running it
The most frequent error is cooling too fast. If you slam the target from 2.0 to 0.2 in one move, the atoms freeze wherever they happen to be and lock in a glassy mess full of defects and grain boundaries. To grow clean hexagonal crystals, lower the temperature in small steps and give the system time to relax at each step, the same way real crystals grow slowly.
A second mistake is confusing target temperature with instantaneous temperature. The thermostat only nudges; the instantaneous value bounces around the target. A single reading of 0.35 when you asked for 0.30 is not a bug, it is a fluctuation of order 1/\sqrt{400} = 0.05.
A third is expecting a crystal at low density. If the density slider is too low the atoms cannot all find six neighbours, so instead of a filled crystal you get droplets or floating clusters with a lot of empty box around them. Raise the density if you want a space-filling lattice.
Drag through the box to stir the fluid and watch the potential energy per atom jump upward as you break bonds, then relax back down when you let go. That rebound is the system re-minimising its energy, the same drive that builds the crystal.
Related simulations to explore
If you like watching order emerge from local rules, several neighbours on this site push the same idea in other directions. The Crystal Growth Simulator builds branching crystals one wandering particle at a time, a different route to solid structure that gives fractal dendrites rather than close-packed rafts. The Reaction-Diffusion Patterns tool grows spots and stripes from two chemicals reacting and spreading. The Belousov-Zhabotinsky Reaction shows a chemical medium organising itself into rotating spiral waves. For a more visual take on heat and flow, the Flame Simulator lets you shape fire with fuel, cooling and wind.
Frequently asked questions
Why is the crystal hexagonal and not square?
In two dimensions, hexagonal packing puts six equal-distance neighbours around each atom at the well-bottom spacing of 1.122\,\sigma, giving the lowest energy. A square lattice gives each atom only four nearest neighbours at that spacing, so it stores less binding energy per atom. The atoms drift to the lower-energy hexagonal arrangement.
What are reduced units?
All quantities are measured against the potential's own scales: energy in units of \varepsilon, length in units of \sigma, and temperature so that k_B = 1. This makes the physics independent of any particular substance. To get real numbers for argon you would multiply by argon's \varepsilon and \sigma.
Why does the temperature reading never sit exactly on my target?
With only a few hundred atoms the instantaneous temperature fluctuates by roughly 1/\sqrt{N}. For N = 400 that is about 0.05. The Berendsen thermostat also relaxes toward the target over a finite time rather than clamping it, so brief excursions are normal.
Can I see the gas, liquid and solid at the same time?
Near the condensation temperature, around T = 0.6, you can catch droplets coexisting with vapour: dense clumps surrounded by a thin gas of escaped atoms. True three-phase coexistence in one snapshot is hard to hold in such a small box, but two phases together is common right at a transition.
Why should I not trust these numbers as real chemistry?
The box is two-dimensional, holds only a few hundred atoms, uses an approximate thermostat, and reports reduced units. It captures the qualitative logic of phase transitions correctly, but any specific temperature or energy is a toy-model figure, not a measurement of a real material.
Related tools
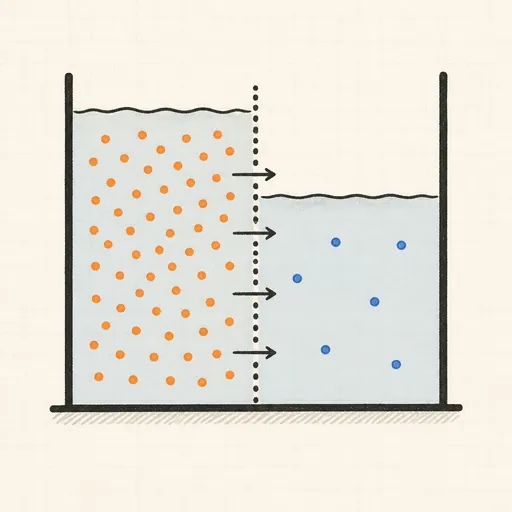
Diffusion & Osmosis
Split a tank with a semipermeable wall and watch particles diffuse and water flow to equalise concentration.
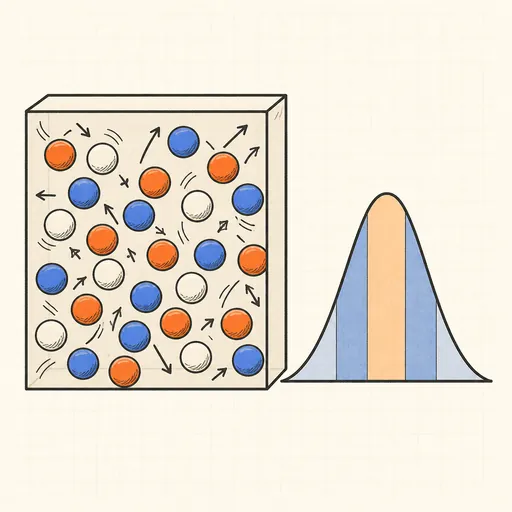
Ideal Gas & Maxwell–Boltzmann
Bounce hard-disc molecules in a box and watch their speeds settle into the Maxwell–Boltzmann distribution.
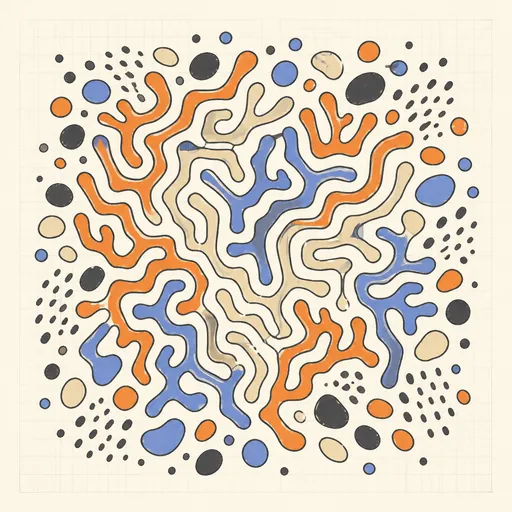
Reaction–Diffusion Patterns
Grow coral, spots and zebra stripes from two virtual chemicals with the Gray–Scott model.
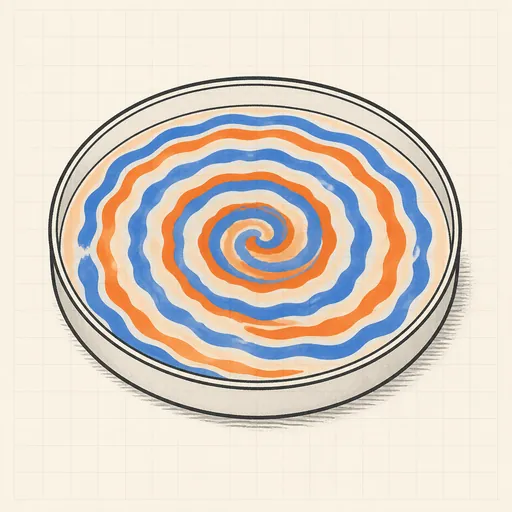
Belousov–Zhabotinsky Reaction
Watch an oscillating chemical medium organize itself into rotating spiral waves.
Crystal Growth Simulator
Grow branching fractal crystals one wandering particle at a time with diffusion-limited aggregation.
Flame Simulator
Paint fire and shape a living flame with fuel, cooling, wind and turbulence.