The Tragedy of the Commons, Explained
After reading this you can predict when a shared fishery collapses under open access, compute its most productive stock size, and check whether a quota or an effort tax will save it.
What the model is, and one hook
A fishery is the cleanest example of a common-pool resource. The fish stock renews itself. Every boat profits from catching more. Nobody owns the fish still swimming, so nobody pays for depleting them. That gap between private gain and shared cost is the tragedy.
The Grand Banks cod off Newfoundland make the point. For four centuries the fishery fed millions. In 1992 it collapsed and Canada closed it. The stock has still not recovered. What changed was not the fish. It was engine power and freezer trawlers that made effort cheap, so boats kept fishing long past the point where the stock could keep up. This simulator lets you drive that same collapse on purpose, then reverse it with policy.
When to use it, and when not
Use this model when a resource grows on its own, many actors draw it down, and access is open or weakly controlled. Groundwater aquifers, grazing land, atmospheric carbon sink, and internet bandwidth all fit the shape. The lesson transfers: private incentives push the resource below its most productive level.
Do not use it as a forecast of any real fishery. Real stocks have age structure, migration, and random recruitment. Real fleets face weather, gear limits, and imperfect information. The model here is deterministic and single-species. It is a thinking tool for the incentive, not a stock-assessment engine.
The economics here come from H. Scott Gordon's 1954 analysis of open-access fisheries. The biology comes from the logistic growth curve, which dates to Verhulst in 1838. The tragedy framing is Garrett Hardin's, 1968.
The two equations behind it
The stock S grows logistically. Left alone it climbs toward the carrying capacity K, fastest when it is halfway there.
Here r is the intrinsic growth rate (per season), K is the carrying capacity (the maximum stock the water supports), and h is the harvest, the total catch this season. The growth term rS(1-S/K) is zero at S=0 and at S=K, and peaks in between.
Set h=0 and find the peak of the growth term by taking its derivative. It maximizes at S=K/2, where growth equals rK/4. That value is the maximum sustainable yield (MSY): the largest catch you can take forever.
The catch depends on effort. With N boats each choosing effort e_i, total effort is E=\sum e_i and the harvest follows the standard catch-per-unit-effort rule.
Here q is the catchability coefficient, the fraction of the stock a unit of effort takes. Catch rises with both effort and how many fish are in the water. Each boat earns revenue p \cdot q \, e_i S at fish price p and pays cost c \cdot e_i at effort cost c. Under open access each boat raises effort while its own profit per unit effort, p q S - c, stays positive.
Where open access stops
A single boat ignores the effect of its effort on everyone else's catch. It keeps fishing until the marginal boat breaks even, meaning revenue per unit effort equals cost per unit effort.
This is the open-access equilibrium stock. Notice what it does not contain: r, K, and the MSY are all absent. The fleet settles where profit hits zero, not where yield is greatest. Push price p up or cost c down and S_{\text{oa}} falls. If it falls below K/2, you are fishing on the wrong side of the growth curve, taking more while the stock produces less. That is the collapse regime.
Reproducing the demo run
Load the tool with its defaults and use these values: r=0.4 per season, K=1000 tonnes, catchability q=0.01, N=20 boats, price p=10 per tonne, and cost c=5 per unit effort. Start the stock at S=1000.
- Maximum sustainable yield: rK/4 = 0.4 \times 1000 / 4 = 100 tonnes per season, taken at a stock of K/2 = 500 tonnes.
- Open-access stock: S_{\text{oa}} = c/(pq) = 5/(10 \times 0.01) = 50 tonnes. That is one twentieth of K, far below the productive 500.
- Sustainable catch at that stock: growth equals rS(1-S/K) = 0.4 \times 50 \times (1 - 0.05) = 19 tonnes per season. The fleet has traded a possible 100 tonnes forever for 19.
- Now cap the total catch with a quota set at the MSY, 100 tonnes, but only while the stock stays above 500. The stock settles near 500 and the fleet lands 100 tonnes each season, five times the open-access harvest.
- Or set an effort tax \tau so that boats break even at S=500: solve pqS = c + \tau, giving \tau = 10 \times 0.01 \times 500 - 5 = 0. That already lands at 500, so a small positive tax holds it there against noise. Raising cost to c=8 without a tax gives S_{\text{oa}} = 8/0.1 = 80 tonnes, still short of 500, which is why cheap effort, not high cost, is the danger.
Reading the charts
Two lines matter. The stock line should sit near K/2 in a healthy fishery, not near K. A stock pinned at the top is being underfished. The catch line should hover near the MSY reference. Under open access you will see the stock plunge toward S_{\text{oa}} while catch first spikes (the fleet strip-mining the abundance) then sags below the reference line.
The chart below shows sustainable yield as a function of stock. Read it left to right: yield climbs to the MSY peak at 500 tonnes, then falls. Open access lands you at 50 tonnes of stock, on the steep left flank, harvesting only 19.
Why two policies both work, differently
A quota caps the catch directly. Set it at or below the MSY and the stock cannot be driven past the productive point, because the fleet is simply not allowed to land more. The weakness is enforcement and the race to fish: boats compete to grab their share of the cap fast, which wastes fuel and gear.
An effort tax fixes the incentive instead. Each boat now pays c+\tau per unit effort, so its break-even stock rises to S_{\text{oa}}=(c+\tau)/(pq). Choose \tau so that this equals K/2 and the greedy fleet stops itself at the right place. This is pricing the externality: the tax makes each boat feel the cost it imposes on all the others.
| Policy | Stock (t) | Catch (t/season) | Sustainable? |
|---|---|---|---|
| Open access | 50 | 19 | Yes but wasteful |
| Quota at MSY | 500 | 100 | Yes |
| Effort tax to K/2 | 500 | 100 | Yes |
| No policy, p=25 | 20 | 7.84 | Near collapse |
Common mistakes
Do not read a full stock as a healthy one. A stock near K=1000 grows almost nothing, since rS(1-S/K) is near zero at both ends. The productive target is the middle, K/2=500, where growth equals the MSY of 100.
Three errors recur. First, treating MSY as a safe target rather than a ceiling: fishing exactly at 100 tonnes leaves no buffer, and one bad recruitment year tips you onto the left flank. Second, expecting open access to find the MSY on its own. It never does. It finds zero profit at c/(pq), which the model shows is 50 here, not 500. Third, assuming a quota and a tax give identical fleets. They give the same stock but different fleet sizes and different waste, because the tax removes the race to fish while a quota does not.
Related tools
The commons is one of several models where independent rational choices produce a collective bad. The Iterated Prisoner's Dilemma Tournament strips the idea to two players and asks when cooperation survives. Braess's Paradox shows a road network where adding capacity makes everyone slower, another gap between private and social optimum. For the biology alone, the Predator–Prey Simulator runs the boom-and-bust cousin of logistic growth, and the SIR Epidemic Simulator shares the same nonlinear-growth-then-saturation shape. To see incentives and taxes drive a whole economy, try the Economy Sandbox.
Frequently asked questions
Why does the fishery collapse if catching fish is profitable?
Because each boat keeps its own profit while spreading the depletion across the whole fleet. It fishes until its own break-even, at stock c/(pq)=50 tonnes here, ignoring that the shared stock is now far below the productive 500. Rational for one boat, ruinous for all.
What is the maximum sustainable yield?
It is the largest catch you can take season after season without shrinking the stock. For logistic growth it equals rK/4, reached when the stock sits at K/2. With r=0.4 and K=1000, that is 100 tonnes per season at a stock of 500.
Is a quota or a tax better?
Both hold the stock at the target. A quota caps the catch and is easy to state but triggers a race to fish. A tax raises each boat's effort cost so it stops itself at the right stock, and it removes the race, but it needs the right rate, \tau=pqK/2-c, which depends on price and cost you must measure.
Why did cheap engines kill fisheries that survived for centuries?
The open-access stock is c/(pq). Lower the cost of effort c and that stock falls. Sail-and-oar fishing was expensive, so boats broke even while plenty of fish remained. Diesel trawlers dropped c far enough to push the break-even stock below the productive point.
Does the model include random luck?
No. It is deterministic. Real fisheries add random recruitment, weather, and migration, any of which can tip a stock over the edge when it is fished near the MSY with no buffer. Treat the model as the incentive skeleton, not a forecast.
Related tools

Gerrymandering Sandbox
Draw the districts yourself and watch the same voters produce opposite election results.
Pareto Frontier Evolution
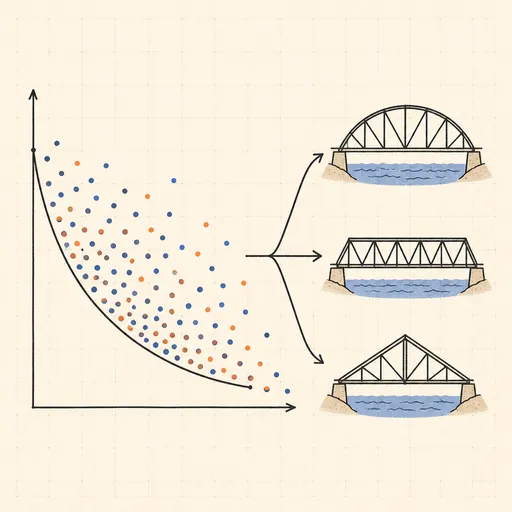
Watch a genetic algorithm breed bridge designs and trace out the weight-vs-stiffness Pareto frontier, generation by generation.

SIR Epidemic Simulator
Watch an epidemic spread and burn out with the classic susceptible–infected–recovered model.

Sailing & Tacking Simulator
Sail a boat against the wind — trim to the polar diagram, ride the shifts and race the optimal route.
Schelling’s Segregation Model
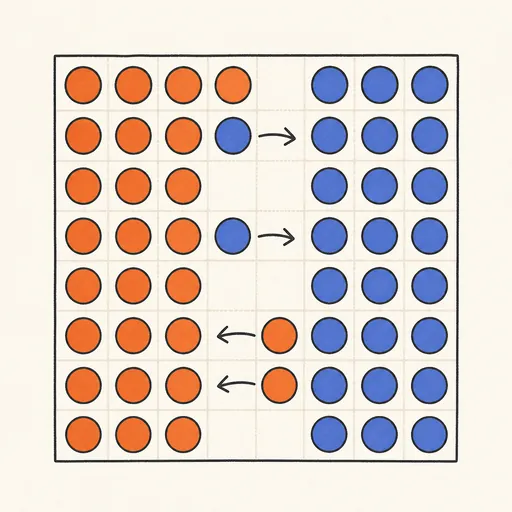
Give agents a mild preference for similar neighbours and watch a mixed city sort itself into stark blocks.
Traffic Jam Simulator
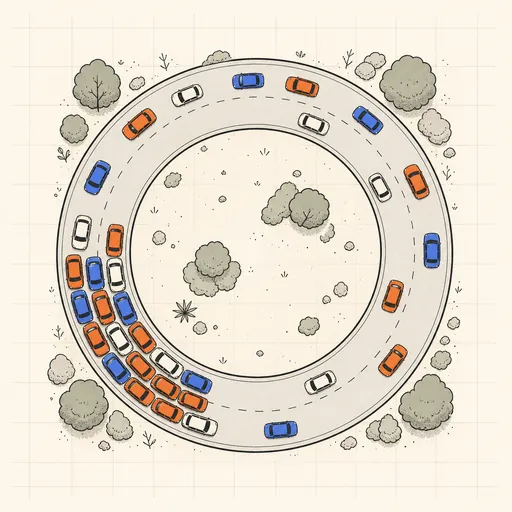
See phantom traffic jams appear from nothing on a ring road with the Nagel–Schreckenberg model.