Schelling’s Segregation Model
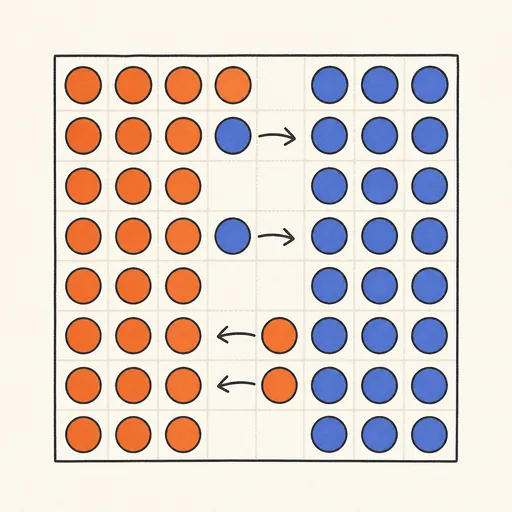
Thomas Schelling’s 1971 model shows how sharp segregation can emerge from mild individual preferences. Two groups of agents live on a grid with some empty spaces. Each agent is happy as long as at least some fraction of its neighbours are the same group; unhappy agents move to a random empty spot. Even when everyone would happily live in a mixed neighbourhood — asking only that they not be a tiny minority — the grid still sorts itself into large single-group blocks. Drag the tolerance threshold, the mix of groups and the vacancy rate, and watch the segregation index climb as the neighbourhoods separate.
Runs 100% in your browser — simulations are computed locally on your device.
Read the full guide to this tool
Notes
- Each agent moves only when the share of like neighbours falls below its threshold, so no one is forced to segregate — the sorting is an unintended collective result of many small individual choices.
- A tolerance as low as 30% (happy to be a minority) is still enough to drive almost complete segregation, the counter-intuitive core of Schelling’s result.
- This is a landmark example of emergence in social science: the large-scale pattern (segregated blocks) looks nothing like the mild preference that produced it.
- Runs 100% in your browser — simulations are computed locally on your device.
Related tools
Gerrymandering Sandbox
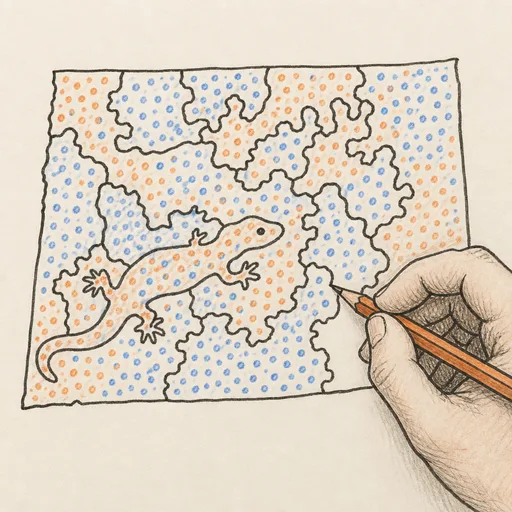
Draw the districts yourself and watch the same voters produce opposite election results.
Pareto Frontier Evolution
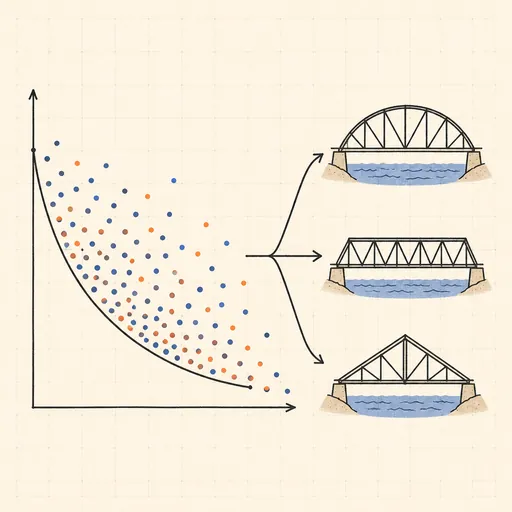
Watch a genetic algorithm breed bridge designs and trace out the weight-vs-stiffness Pareto frontier, generation by generation.
SIR Epidemic Simulator
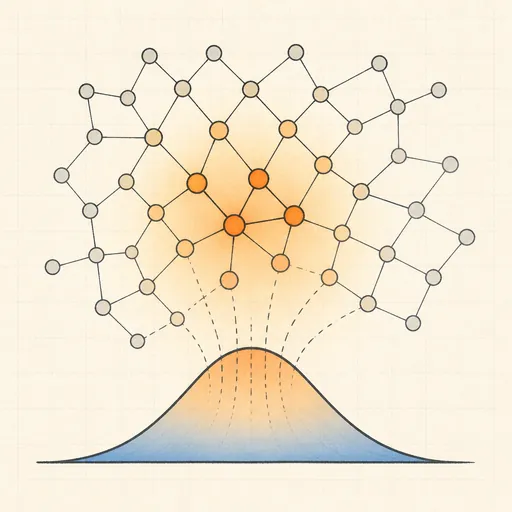
Watch an epidemic spread and burn out with the classic susceptible–infected–recovered model.
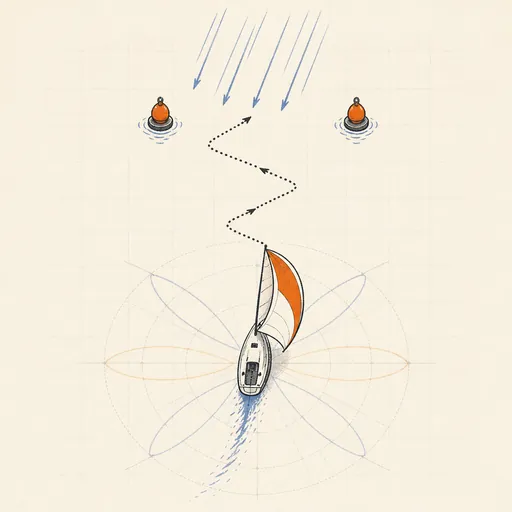
Sailing & Tacking Simulator
Sail a boat against the wind — trim to the polar diagram, ride the shifts and race the optimal route.
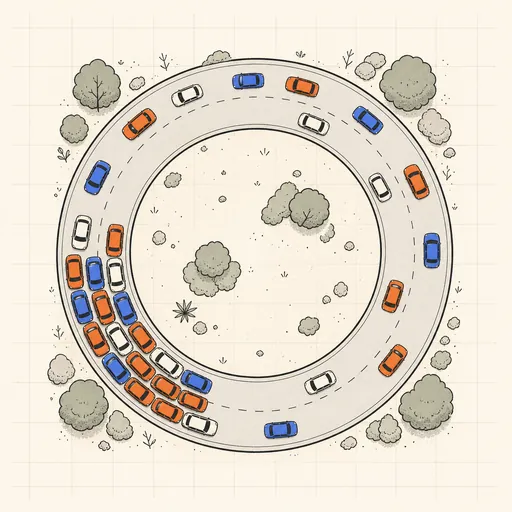
Traffic Jam Simulator
See phantom traffic jams appear from nothing on a ring road with the Nagel–Schreckenberg model.
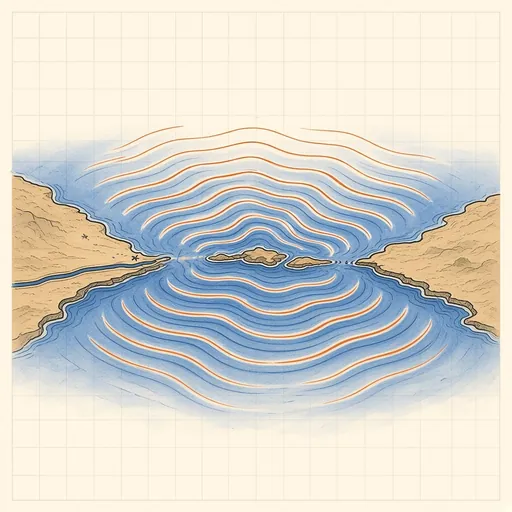
Tsunami Simulator
Set off an undersea earthquake anywhere and watch the tsunami cross real ocean floors — with arrival times at tide gauges around the world.