k-Means Clustering, Explained
After reading this you will be able to run Lloyd's algorithm by hand on a handful of points, read the inertia curve, pick k with an elbow plot, and recognize the shapes where k-means quietly gives you nonsense.
What k-means does
k-means splits a set of points into k groups so that points in the same group sit close together. It represents each group by a single point called a centroid, and it measures "close together" as squared Euclidean distance. Give it four Gaussian blobs and choose k = 4, and after a few iterations each centroid parks itself in the middle of one blob. That is the whole hook: centroids chase the middles of your point clouds.
The algorithm alternates two steps. First it assigns every point to the nearest centroid. Then it moves every centroid to the mean of the points now assigned to it. Repeat until nothing moves. The tool shows this directly: points recolour during the assignment step, and centroids glide to their new means with trails during the update step. The shaded regions behind the points are Voronoi cells, one per centroid, marking the territory where that centroid is the closest one.
When to use it, and when not to
Use k-means when your clusters are roughly round, roughly equal in size, and separated by gaps. It is fast, it is easy to explain, and one iteration costs O(n \cdot k \cdot d) for n points in d dimensions. On the Gaussian-blobs preset it converges in three or four iterations and lands on the obvious answer.
Avoid it when clusters are elongated, nested, or wildly different in size, and when the shape of a cluster is not convex. The two-moons preset is the standard trap. Each moon is a crescent, and no straight boundary separates them. k-means always draws straight boundaries (the walls between Voronoi cells), so it slices each moon in half and mixes the two. Try the moons preset in the tool and watch it fail no matter how you initialize.
k-means never returns "no cluster here" or "this point is noise". Every point gets assigned to some centroid, including outliers, which drag centroids away from the real mass. If you need noise handling or non-convex shapes, reach for a density method instead.
The objective and the two update rules
k-means minimizes a single quantity called inertia, the within-cluster sum of squares:
Here C_k is the set of points assigned to cluster k, \mu_k is that cluster's centroid, x_i is a point, and \lVert x_i - \mu_k \rVert^2 is the squared distance from the point to its centroid. Small J means tight clusters.
Each step drives J down. The assignment step is optimal for fixed centroids: sending each point to its nearest centroid can only lower or keep each squared distance. The update step is optimal for fixed assignments, because the value that minimizes the sum of squared distances to a set of points is exactly their mean:
The mean minimizes squared error. If your points on one axis are 1, 2, 6, the mean is 3, and the sum of squared deviations is (1-3)^2 + (2-3)^2 + (6-3)^2 = 4 + 1 + 9 = 14. Try any other center, say 2.5, and you get 2.25 + 0.25 + 12.25 = 14.75, which is larger. Because both steps lower J and there are only finitely many ways to assign n points to k clusters, the loop must stop.
A worked example you can reproduce
Six points, k = 2, by hand
Take six points in two tight groups: A(1,1), B(1,2), C(2,1) on the left, and D(8,8), E(8,9), F(9,8) on the right. Start with two centroids badly placed at \mu_1 = (1,1) and \mu_2 = (2,1), both on the left.
- Assign, round 1. Compare each point's squared distance to the two centroids.
Ais at \mu_1 (distance 0) so it joins cluster 1.Cis at \mu_2 so it joins cluster 2.B(1,2)is distance1from \mu_1 and2from \mu_2, so cluster 1. Every right-side point is far from both, but slightly closer to \mu_2 = (2,1), soD, E, Fjoin cluster 2. Clusters: {A, B} and {C, D, E, F}. - Update, round 1. New centroids are the means. Cluster 1: ((1+1)/2, (1+2)/2) = (1, 1.5). Cluster 2: ((2+8+8+9)/4, (1+8+9+8)/4) = (6.75, 6.5).
- Assign, round 2. Now \mu_2 sits near the right group. Point
C(2,1)is squared distance (2-1)^2 + (1-1.5)^2 = 1.25 from \mu_1 and (2-6.75)^2 + (1-6.5)^2 = 22.56 + 30.25 = 52.81 from \mu_2, soCswitches to cluster 1. The right points stay in cluster 2. Clusters: {A, B, C} and {D, E, F}. - Update, round 2. Cluster 1 mean: ((1+1+2)/3, (1+2+1)/3) = (1.333, 1.333). Cluster 2 mean: ((8+8+9)/3, (8+9+8)/3) = (8.333, 8.333).
- Assign, round 3. Nothing changes. The algorithm has converged.
Final inertia: each left point is squared distance about 0.222 + 0.222 = 0.444 or 0.444 from (1.333, 1.333); the three sum to 1.333. By symmetry the right cluster also sums to 1.333. Total inertia \approx 2.667. A bad start recovered the correct split in three rounds, but that is not guaranteed, which is the next point.
Initialization and local optima
k-means only finds a local minimum of inertia, and which one depends on where the centroids start. Plain random initialization sometimes drops two centroids inside one true cluster and none in another, and the algorithm cannot recover: it will happily split one blob in two and merge two others.
k-means++ reduces this risk. It picks the first centroid at random, then picks each later centroid from the remaining points with probability proportional to the squared distance to the nearest existing centroid. Far-away points are more likely to be chosen, so the seeds spread out. This bounds the expected inertia within a factor of O(\log k) of the best possible. In the tool, use the restart button to re-roll the initialization and watch the final inertia change. If ten restarts all give inertia near 2.667 on your data but one gives 40, that outlier is a bad local optimum you would discard.
In practice, run k-means several times with different seeds and keep the run with the lowest inertia. The demo's restart button lets you see the spread by hand before you trust a single result.
Choosing k with the elbow curve
Inertia always drops as you add clusters, because more centroids means every point can sit closer to one. At k = n each point is its own centroid and inertia is 0. So you cannot pick k by minimizing inertia; it would always choose the largest k. Instead, plot inertia against k and look for the elbow, the point where the curve stops dropping steeply and flattens out. That is the elbow-curve button in the tool, which runs k = 1 through 10.
For four well-separated blobs, inertia falls fast from k = 1 to k = 4 and then only crawls, because the fourth split finished the real structure and the fifth just carves a real cluster in two. The bend at k = 4 is the elbow.
Common mistakes
Three errors account for most bad k-means results.
- Unscaled features
- k-means uses raw Euclidean distance, so a feature measured in thousands dominates one measured in fractions. If age ranges
0to80and income ranges0to200000, income decides every assignment. Standardize each feature (subtract the mean, divide by the standard deviation) before clustering. - Wrong shape
- Elongated or nested clusters break the convex-cell assumption. On the elongated-clusters preset, watch k-means cut a long thin cluster crosswise because a straight Voronoi wall is the only tool it has.
- Reading the elbow as exact
- The elbow is a heuristic, not a proof. Real data often has a soft bend, not a sharp corner. If the curve is smooth, k-means is telling you there is no single right
k, and you should question whether the clusters are real.
Related tools on this site
k-means is one clustering method among several, and the others fix its weaknesses in different ways. DBSCAN Clustering grows clusters by density and labels sparse points as noise, so it handles the two moons and outliers that defeat k-means. Gaussian Mixture & EM generalizes k-means to soft, elliptical clusters: each point gets a probability of belonging to each cluster, and clusters can stretch and tilt. Hierarchical Clustering & Dendrogram builds a tree of merges so you can choose the number of clusters after seeing the structure rather than before.
If your data has many dimensions, run PCA Toy or the t-SNE Explorer first to see the layout, though be careful: t-SNE distances are not distances k-means should trust. The Self-Organizing Map learns a grid that follows the data shape, and the Anomaly Detection Playground focuses on the outliers k-means ignores.
Frequently asked questions
How do I choose the number of clusters k?
There is no automatic answer from k-means alone, because inertia always falls as k rises. Plot inertia for k = 1 to 10 with the elbow-curve button and pick the bend. Cross-check with domain knowledge and with a silhouette score if you need a number.
Why does k-means give different results each time I run it?
The starting centroids are random, and k-means only finds a local minimum. Different seeds land in different valleys of the inertia surface. Run it several times with the restart button and keep the lowest inertia, or use k-means++ to make good starts more likely.
Why does k-means fail on the two-moons data?
Each centroid owns a convex Voronoi cell, so every cluster boundary is a straight line (or flat plane). A crescent is not convex, so no set of straight walls can separate two interlocking moons. Density-based DBSCAN handles this because it follows connected dense regions instead.
Do I need to scale my features first?
Almost always yes. Euclidean distance adds up squared differences across features, so a large-range feature dominates. Standardize each column to mean 0 and standard deviation 1 unless the raw units genuinely carry the importance you want.
What is inertia and is lower always better?
Inertia is the total squared distance from points to their assigned centroids. Lower is better for a fixed k, so compare runs at the same k. Comparing inertia across different k is meaningless, since more clusters always lower it.
Related tools
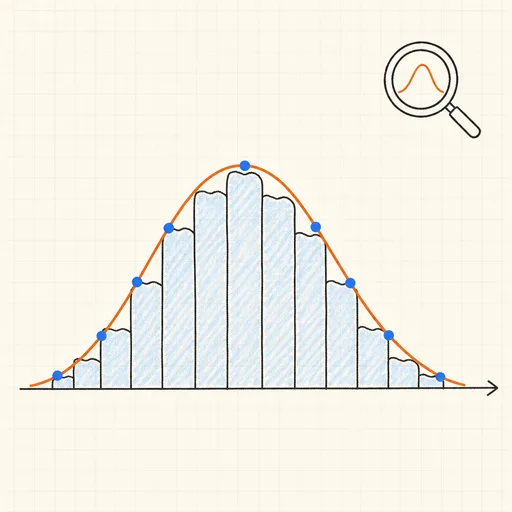
Distribution Sketcher
Sketch the shape of a probability density — or paste raw data — and search 16 distributions for the ones that fit it best.
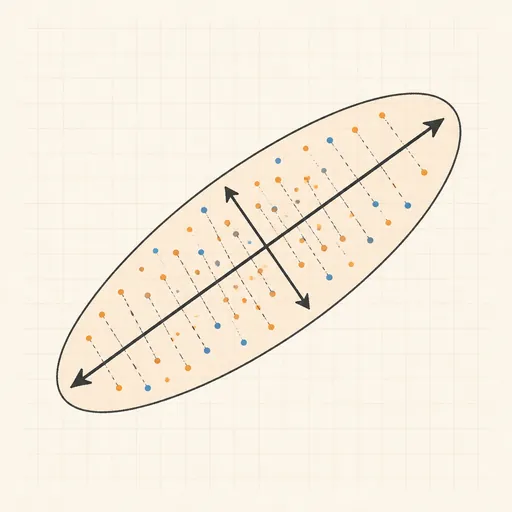
PCA Toy
Find the axes of maximum variance and flatten a point cloud onto them.
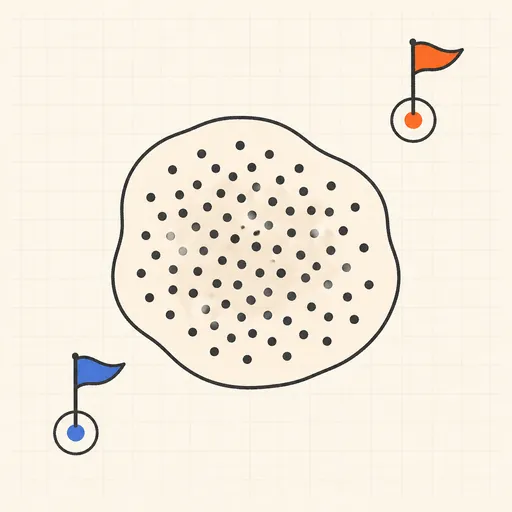
Anomaly Detection Playground
Flag outliers three different ways and see where each score breaks down.
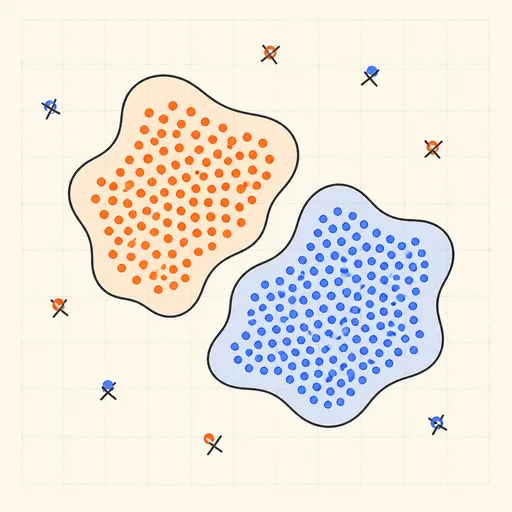
DBSCAN Clustering
Grow density-based clusters point by point and watch noise get left behind.
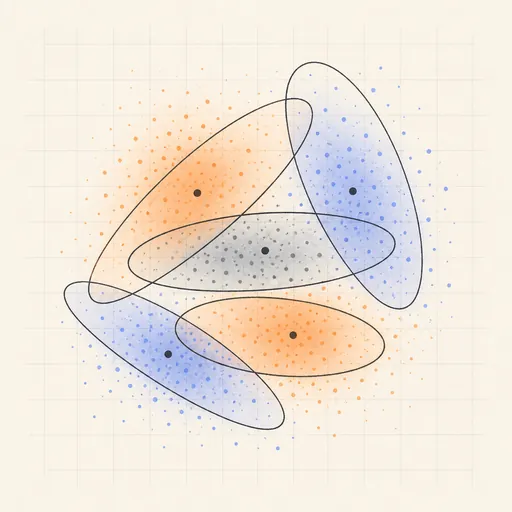
Gaussian Mixture & EM
Fit soft, elliptical clusters with the expectation–maximization algorithm.
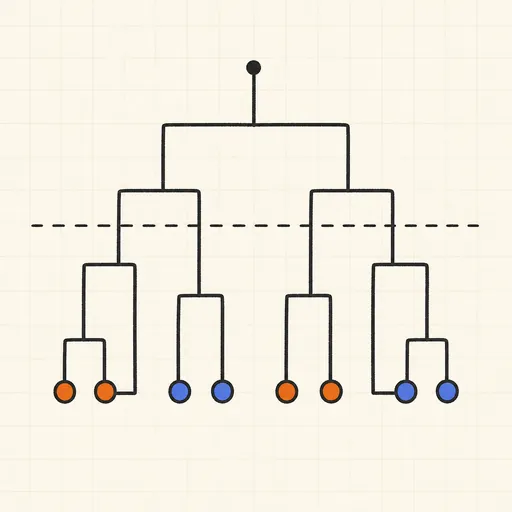
Hierarchical Clustering & Dendrogram
Merge points bottom-up and cut the dendrogram wherever you like.