t-SNE Explorer
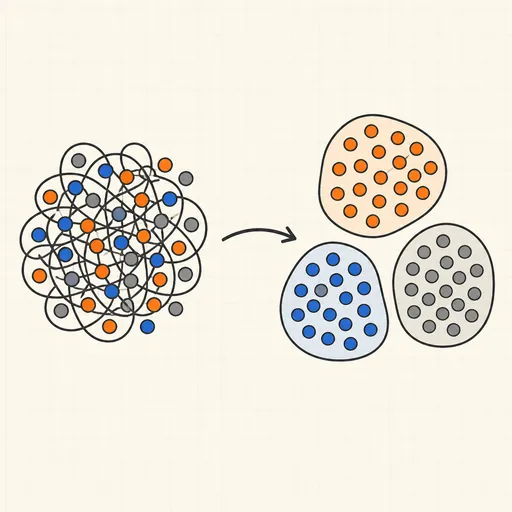
t-SNE embeds high-dimensional data in 2D by matching neighbourhoods: it converts pairwise distances into probabilities that points are neighbours (a Gaussian kernel in high dimension, a heavy-tailed Student-t in the embedding) and moves the 2D points by gradient descent to minimise the KL divergence between the two. Pick a synthetic dataset — four Gaussian clusters in 10D, three clusters in 50D, a 3D swiss roll, two linked rings, or a 2D grid as a sanity check — set the perplexity (the effective number of neighbours each point considers) and learning rate, and press play to watch the embedding organise itself, points coloured by their true labels. Re-run with a fresh random init to see how layouts differ, and toggle the PCA ghosts to compare against a plain linear projection of the same data.
Runs 100% in your browser — models are trained and computed locally on your device.
Read the full guide to this tool
Notes
- The gradient is 4Σⱼ(pᵢⱼ − qᵢⱼ)(yᵢ − yⱼ)/(1 + ‖yᵢ − yⱼ‖²); the heavy-tailed t kernel in the embedding is what pushes dissimilar points far apart and prevents crowding.
- Perplexity sets each point’s Gaussian bandwidth by binary search: low values expose fine local structure and may shatter clusters, high values favour global shape. Always try several.
- This exact implementation is O(n²) per iteration — fine for 300 points; Barnes–Hut and FFT variants bring it to O(n log n) for real datasets.
- Cluster sizes and between-cluster distances in a t-SNE plot are not meaningful — the algorithm preserves neighbourhoods, not distances, and different random inits give different (equally valid) layouts.
- Early exaggeration multiplies the attractive probabilities during the first iterations so clusters separate cleanly before fine-tuning.
- Runs 100% in your browser — models are trained and computed locally on your device.
Related tools
Distribution Sketcher
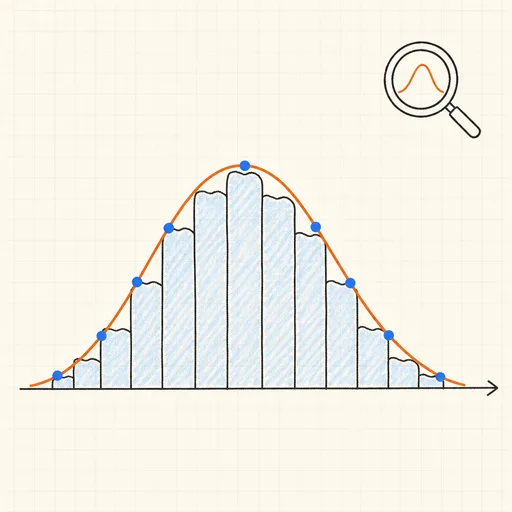
Sketch the shape of a probability density — or paste raw data — and search 16 distributions for the ones that fit it best.
PCA Toy
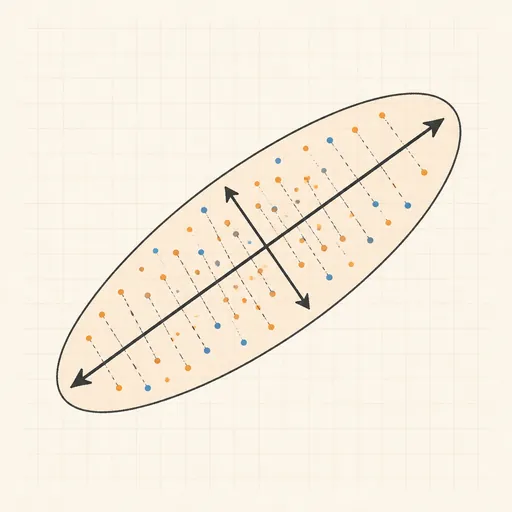
Find the axes of maximum variance and flatten a point cloud onto them.
k-Means Clustering
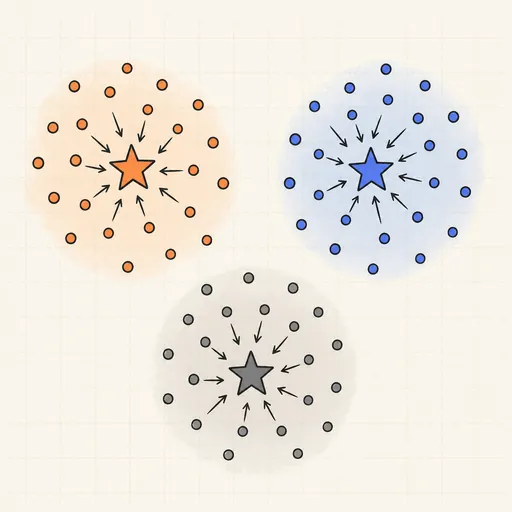
Step through Lloyd’s algorithm and watch centroids chase the middles of your point clouds.
Anomaly Detection Playground
Flag outliers three different ways and see where each score breaks down.
DBSCAN Clustering
Grow density-based clusters point by point and watch noise get left behind.
Gaussian Mixture & EM
Fit soft, elliptical clusters with the expectation–maximization algorithm.