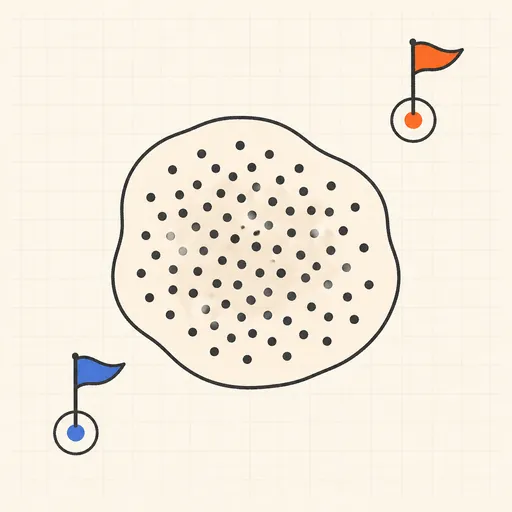
Anomaly Detection Playground
Anomaly detection scores how unusual each point is and flags the worst offenders. Scatter a preset — a blob with scattered outliers, two clusters joined by a bridge, or a ring with a dense core — or click to add points, then compare three detectors: per-axis z-scores (distance from the mean in standard deviations, one axis at a time), Mahalanobis distance (which accounts for correlation and draws its threshold as an ellipse), and a lite isolation forest (an ensemble of random axis-aligned splitting trees where points isolated in few splits score as anomalies). The contamination slider sets what fraction of points gets flagged; anomalies turn red with a score halo, and a heatmap toggle shades the whole plane by anomaly score so you can see exactly what each method considers normal.
Runs 100% in your browser — models are trained and computed locally on your device.
Read the full guide to this tool
Notes
- The z-score |x − μ|/σ per axis only sees axis-aligned deviation: a point far from the cloud but inside both 1D ranges — off the diagonal of a correlated cloud — slips through unflagged.
- Mahalanobis distance √((x − μ)ᵀΣ⁻¹(x − μ)) whitens by the covariance, so its threshold contour is an ellipse aligned with the data — exact for one Gaussian cloud, misleading for two clusters or a ring, where the safest spot by this score is the empty middle.
- Isolation forest scores by average isolation depth: anomalies fall in sparse regions that random axis-aligned splits fence off quickly, so the score is 2^(−E[h]/c(n)), needs no distribution assumption, and adapts to multiple clusters.
- Contamination is a knob, not knowledge: flagging a fixed fraction always flags something, even in clean data — in practice the threshold should come from labelled examples or domain limits.
- Runs 100% in your browser — models are trained and computed locally on your device.
Related tools
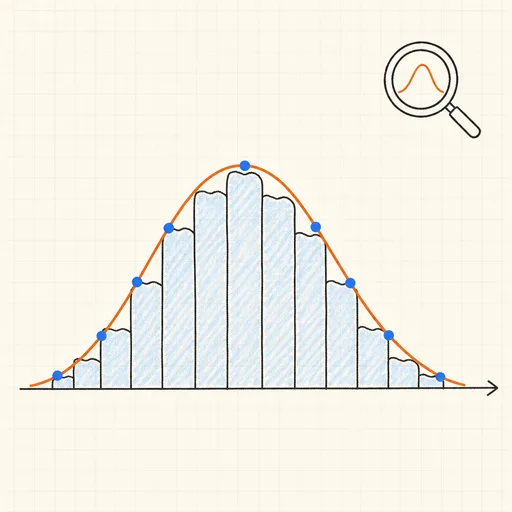
Distribution Sketcher
Sketch the shape of a probability density — or paste raw data — and search 16 distributions for the ones that fit it best.
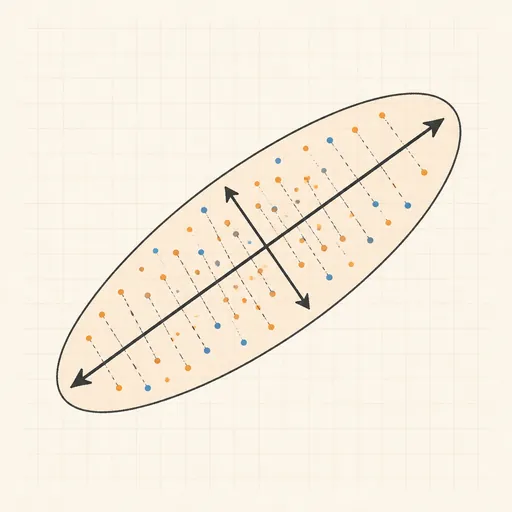
PCA Toy
Find the axes of maximum variance and flatten a point cloud onto them.
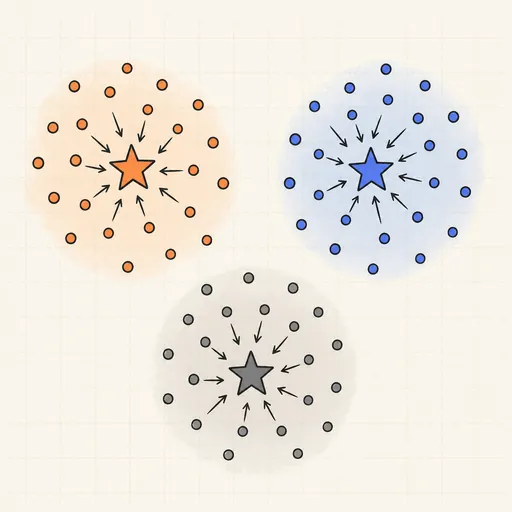
k-Means Clustering
Step through Lloyd’s algorithm and watch centroids chase the middles of your point clouds.
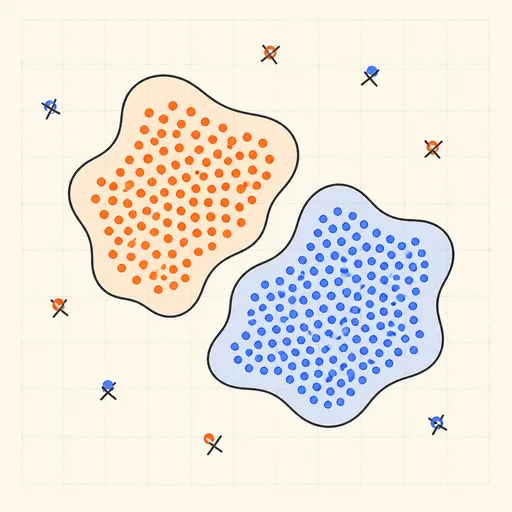
DBSCAN Clustering
Grow density-based clusters point by point and watch noise get left behind.
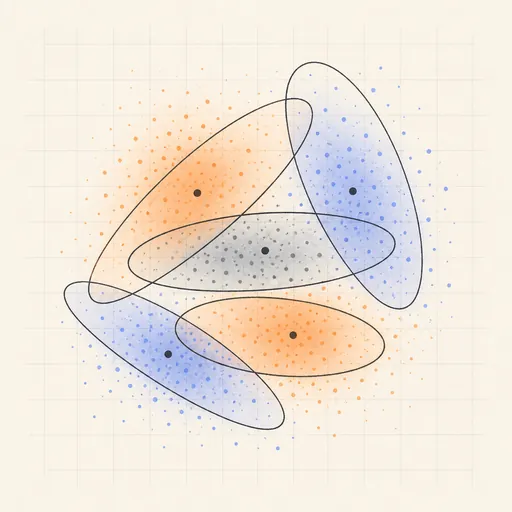
Gaussian Mixture & EM
Fit soft, elliptical clusters with the expectation–maximization algorithm.
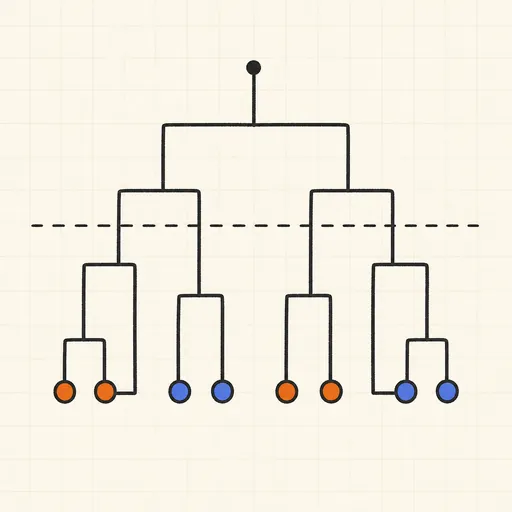
Hierarchical Clustering & Dendrogram
Merge points bottom-up and cut the dendrogram wherever you like.