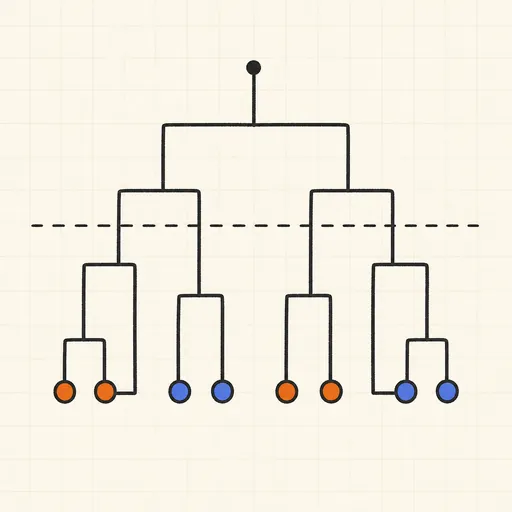
Hierarchical Clustering & Dendrogram
Agglomerative clustering starts with every point as its own cluster and repeatedly merges the two closest clusters until one remains; the whole merge history is a tree called a dendrogram. Scatter up to 60 points from a preset (three blobs, two moons, uniform) or by clicking, choose a linkage — single, complete, average or Ward — and play: the left canvas shows points recolouring under growing cluster hulls as merges happen one by one, while the right canvas builds the dendrogram bottom-up, each junction drawn at its merge distance. Drag the cut-height slider to slice the dendrogram with a dashed line and recolour the points into the clusters that cut produces — one tree answers every choice of cluster count. Try single linkage on the moons preset to see chaining follow the curved shapes.
Runs 100% in your browser — models are trained and computed locally on your device.
Read the full guide to this tool
Notes
- Linkage defines cluster distance: single takes the minimum pairwise distance, complete the maximum, average the mean, and Ward merges the pair that increases total within-cluster variance the least.
- All four linkages update distances after a merge with one Lance–Williams formula d(i∪j, k) = αᵢd(i,k) + αⱼd(j,k) + βd(i,j) + γ|d(i,k) − d(j,k)|, only the coefficients differ.
- Single linkage chains: it happily connects long thin shapes like the moons, but one noisy bridge point can fuse two genuine clusters. Complete and Ward prefer compact round clusters instead.
- The naive algorithm used here is O(n³) time and O(n²) memory — fine for 60 points, hopeless for a million; that is why k-means scales better.
- Runs 100% in your browser — models are trained and computed locally on your device.
Related tools
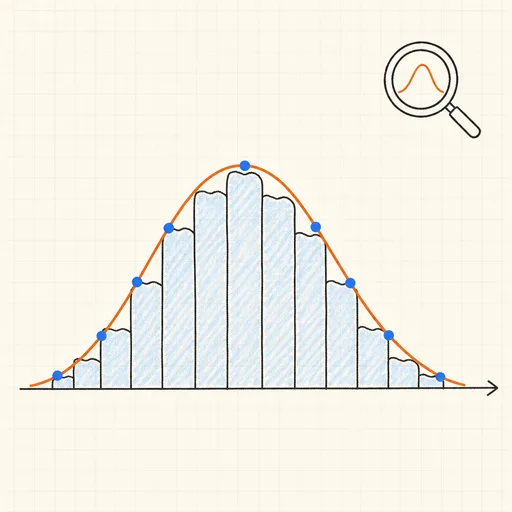
Distribution Sketcher
Sketch the shape of a probability density — or paste raw data — and search 16 distributions for the ones that fit it best.
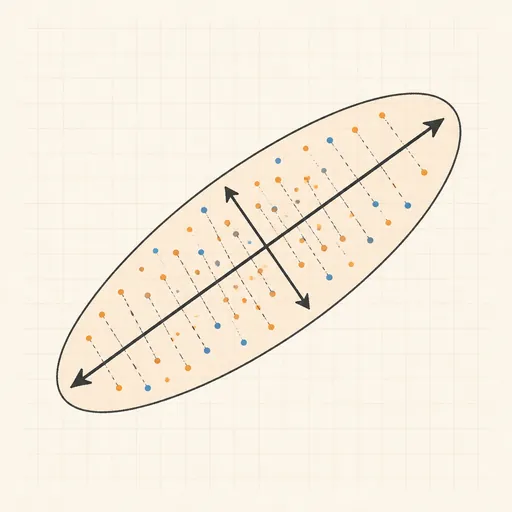
PCA Toy
Find the axes of maximum variance and flatten a point cloud onto them.
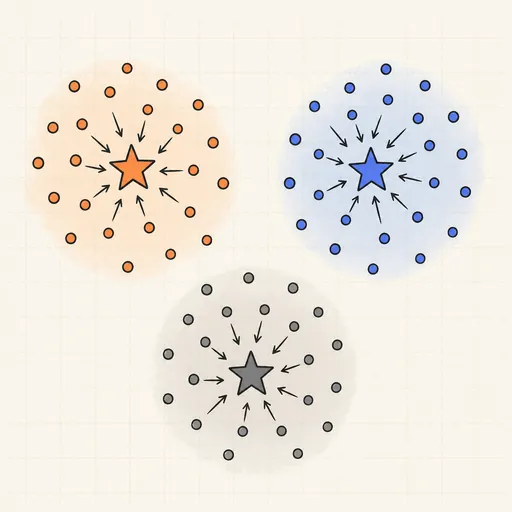
k-Means Clustering
Step through Lloyd’s algorithm and watch centroids chase the middles of your point clouds.
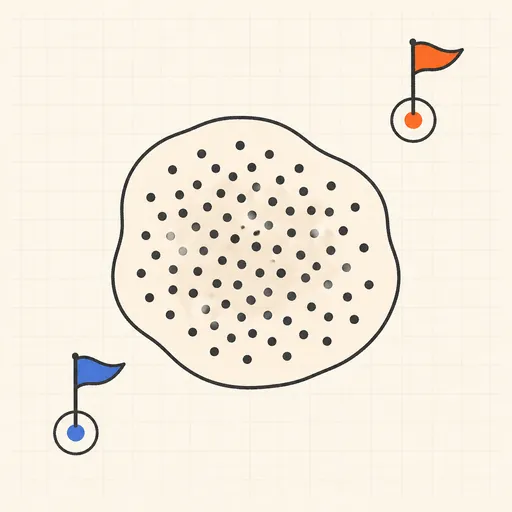
Anomaly Detection Playground
Flag outliers three different ways and see where each score breaks down.
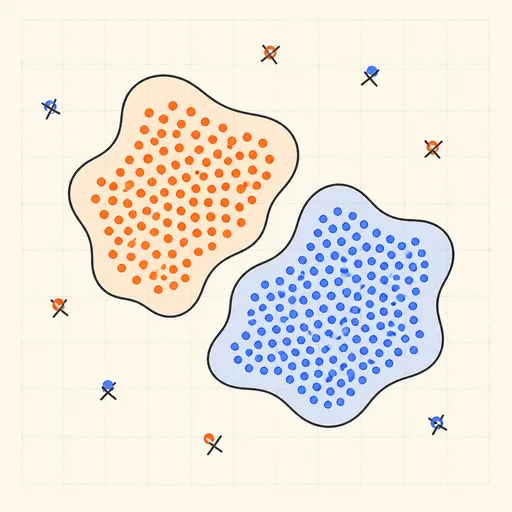
DBSCAN Clustering
Grow density-based clusters point by point and watch noise get left behind.
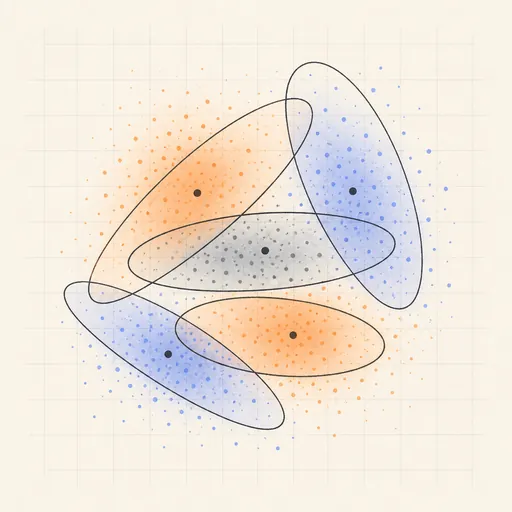
Gaussian Mixture & EM
Fit soft, elliptical clusters with the expectation–maximization algorithm.