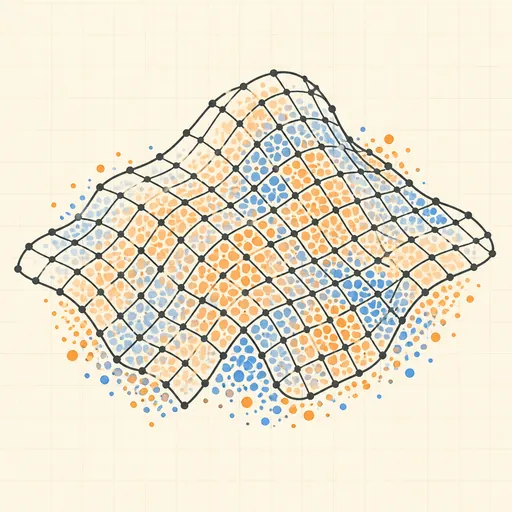
Self-Organizing Map
A self-organizing map is a grid of neurons that learns the shape of a dataset without labels: each training step picks a random sample, finds the best-matching neuron, and pulls that neuron and its grid neighbours toward the sample, with both the learning rate and the neighbourhood radius decaying over time. In Color mode a grid of random RGB cells organises itself into a smooth rainbow as random colours train it — hypnotic to watch — and a U-matrix toggle reveals the boundaries between colour regions. In 2D point mode the neuron grid is drawn as a mesh over a dataset (ring, two blobs, or uniform square) and unfolds to cover it. Adjust the grid size, initial learning rate and initial neighbourhood σ, and watch the current decayed values tick down in the status line.
Runs 100% in your browser — models are trained and computed locally on your device.
Read the full guide to this tool
Notes
- Update rule: wᵥ ← wᵥ + α(t)·h(v, b, t)·(x − wᵥ), where b is the best-matching unit and h is a Gaussian in grid distance — crucially distance on the grid, not in data space, which is what forces topological order.
- Learning rate and neighbourhood radius both decay exponentially; the early wide-neighbourhood phase establishes global order and the late narrow phase fine-tunes — shrink σ too fast and the map twists into permanent kinks.
- The U-matrix shades each neuron by its average distance to grid neighbours: dark ridges are cluster boundaries, light valleys are cluster interiors.
- A SOM is a topology-preserving projection like a nonlinear PCA: grid neighbours stay neighbours in data space, but unlike PCA there is no cost function it provably minimises.
- Runs 100% in your browser — models are trained and computed locally on your device.
Related tools
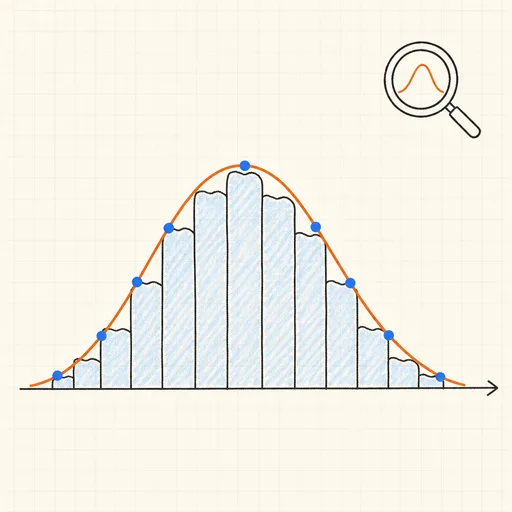
Distribution Sketcher
Sketch the shape of a probability density — or paste raw data — and search 16 distributions for the ones that fit it best.
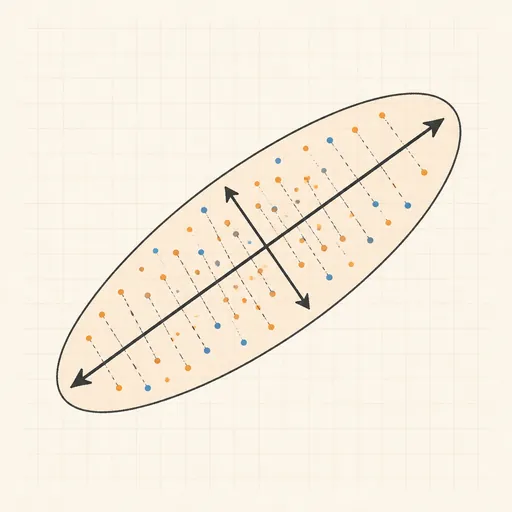
PCA Toy
Find the axes of maximum variance and flatten a point cloud onto them.
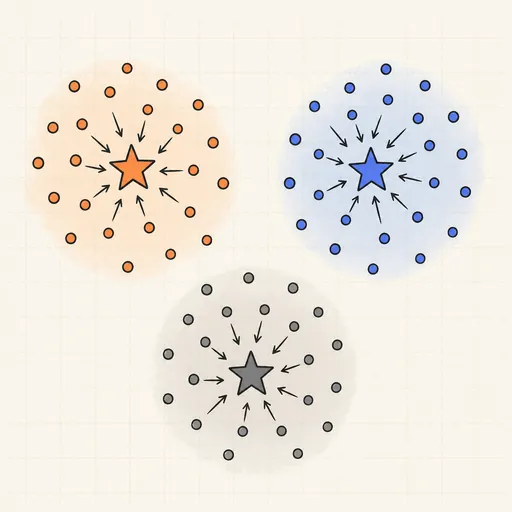
k-Means Clustering
Step through Lloyd’s algorithm and watch centroids chase the middles of your point clouds.
Anomaly Detection Playground
Flag outliers three different ways and see where each score breaks down.
DBSCAN Clustering
Grow density-based clusters point by point and watch noise get left behind.
Gaussian Mixture & EM
Fit soft, elliptical clusters with the expectation–maximization algorithm.