Roller Coaster Physics, Explained
After reading this you will be able to predict whether a coaster train clears every hill, compute the g-force riders feel in a valley or over a crest, and see why a circular loop that looks fine on paper presses riders into their seats with more than 6 g.
A roller coaster has no engine for most of its ride. A chain lift drags the train up one tall hill, lets go, and gravity does the rest. Everything after the crest of the lift is a trade between two quantities: height and speed. The train is tall and slow at the top, short and fast at the bottom, and the sum of the two stays almost constant. "Almost" is where the engineering lives.
Here is the hook. Suppose your lift hill is 40 metres tall. The train crests it at a crawl, say 0.5\ \text{m/s}. By the bottom of the first drop it reaches about 28\ \text{m/s} (roughly 100 km/h). If the next hill is 35 metres, the train tops it at about 10\ \text{m/s}. If the next hill were 41 metres, higher than the lift, the train would stop short and roll backward. No hill may ever exceed the lift. The tool lets you build that mistake and watch the train stall.
What this tool is, and the one law behind it
The Roller Coaster Designer is a side-view sandbox. You shape a track out of draggable points, choose a chain lift or a launch, add loops into the valleys, and the train rides your design immediately. The simulation treats the train as a point mass rolling along the rail, with gravity pulling along the track, rolling friction, and air drag. You watch speed, height, g-force and energy along the whole ride.
The governing law is conservation of energy. The train carries kinetic energy from its motion and potential energy from its height. In a frictionless world their sum never changes.
Here m is the train mass in kilograms, v is speed in metres per second, g = 9.81\ \text{m/s}^2 is gravity, and h is height in metres. The mass cancels out of every speed and g-force result, which is why a packed train and an empty one ride the same curve. What matters is where the energy sits: all in mgh at the top, all in \tfrac{1}{2}mv^2 at the lowest point.
When this model helps, and when it lies
Use the model to reason about speeds, clearances and g-forces on a planned layout. It answers questions like "will the train make it over the third hill?" and "how tight can this valley be before riders grey out?" with numbers good enough to compare designs and catch mistakes.
The model is a toy in three honest ways. First, a real train is not a point: its front cars crest a hill while the back is still climbing, so the speed at any instant depends on the whole train, not one point. Second, real friction and drag depend on bearing wear, wheel temperature and wind, which the model fixes at constant coefficients. Third, lateral g-force from curves that bend left and right is ignored here; only vertical g in the side-view plane is shown. Treat the output as a confident first draft, not a stamped engineering drawing.
Real coaster engineers run exactly this energy bookkeeping first, then refine it with full multibody dynamics. The point-mass version decides the layout; the detailed model decides the steel.
The g-force formula and why your stomach knows it
Weight you feel is not the same as the force of gravity. What you feel is the force the seat pushes up through you, divided by your normal weight. On flat track at rest that is exactly 1 g. On a curved piece of track, the rail must also bend the train's path, and that extra force adds to or subtracts from what you feel.
Here r is the radius of the curve in metres, v is the speed at that point, and g = 9.81\ \text{m/s}^2. In a valley (track curving upward) the sign is plus: you feel heavier. Over a crest (track curving downward) the sign is minus: you feel lighter, and when the term exceeds 1 you feel negative g and lift out of the seat. That lift is airtime, the thing airtime-hunters ride for.
The v^2 is the danger. Double the speed through a valley of the same radius and the extra g quadruples. Designers hold the felt g below about 5 (above that a sustained load greys out vision as blood drains from the head) and above about -1.5 (below that riders strain against the restraints).
A worked example with the Classic hills track
From the lift to the second hill
The simulator opens with the Classic hills preset. The station and the valleys sit 3 m above the ground, the chain lift tops out at 42 m and lets the train go at the chain speed of 3.5 m/s, and the second hill is 30 m tall. Start with the friction set to None (ideal), then switch it back to Realistic.
- At the top of the lift the train is 39 m above the valley floor and moving at 3.5 m/s. Its energy per kilogram, measured from the valley floor, is \tfrac{1}{2}(3.5)^2 + 9.81 \times 39 = 6.1 + 382.6 = 388.7\ \text{J/kg}.
- At the bottom of the first drop all of it is kinetic: \tfrac{1}{2}v^2 = 388.7, so v = \sqrt{777.4} = 27.9\ \text{m/s}, or 100 km/h. That is the top speed the simulator shows without friction.
- The second crest is 27 m above the valley floor: \tfrac{1}{2}v^2 = 388.7 - 9.81 \times 27 = 123.8, so v = \sqrt{247.6} = 15.7\ \text{m/s} (57 km/h). The train clears it easily.
- G-force in the first valley. Between the lift crest at x = 40 m and the valley at x = 120 m the track falls 39 m over 80 m, and its radius at the bottom is 80^2 / (6 \times 39) = 27.4 m. Felt g: 1 + \frac{27.9^2}{9.81 \times 27.4} = 1 + 2.9 = 3.9 g.
- G-force over the second crest. That hill falls 26 m over 62 m on its far side, a radius of 62^2 / (6 \times 26) = 24.6 m. Felt g: 1 - \frac{15.7^2}{9.81 \times 24.6} = 1 - 1.02, about 0 g. Riders float off their seats for a moment.
- Now switch the friction back to Realistic. The top speed drops to 97 km/h (26.8 m/s), the valley load to 3.7 g, and the train reaches the second crest at only 11.9 m/s, where riders feel 0.4 g instead of floating. Friction has already taken 53 J/kg of the train's energy.
Where does h^2 / (6\Delta y) come from? Each stretch between a crest and a valley in this simulator is a smooth cubic that is level at both ends, and that is its radius of curvature at a level end. Spread the points apart and the radius grows with the square of the spacing.
To see a stall, load the Hill too tall: rollback preset. Its lift is 30 m and its second hill 33 m. Even with no friction the train stops 2 m short of that crest and rolls back; with realistic friction it is 6 m short.
Reading the g-force colours and the energy bars
The ride view colours each stretch of rail by the felt g. Green covers the ordinary range from 0 to 2 g, yellow runs up to 3.5 g, orange up to 5 g, and red marks anything above 5 g, where riders start to grey out. Light blue is airtime below 0 g, and violet is ejector airtime below -1.5 g, which slams riders into the lap bars. Scan for the colour extremes: that is where your design is doing something to a rider's body.
The energy bars show the same conservation law as a running balance. At the lift top the potential bar is full and the kinetic bar is nearly empty. As the train descends, height pours into speed. A third bar, heat, grows steadily and never shrinks: that is the friction and drag loss, and it is why every hill must be lower than the last. On the Classic hills track with realistic friction, about a third of the energy the train had at the top of the lift (138 of 418 J/kg) has turned into heat by the time it reaches the brakes, which is why its camelbacks step down from 30 m to 20 m to 12 m.
Common mistakes that stall or hurt
The first mistake is a hill taller than the lift. The energy budget forbids it. The simulator rolls the train back and tells you where it stalled and how many metres short of the crest it was.
The second is a valley radius that is too small. A tight valley at high speed is where g-force runs away. On the Classic hills track the first drop bottoms out near 28 m/s. Put a 10 m valley radius there and the felt g is 1 + \frac{28^2}{9.81 \times 10} = 1 + 7.99 = 8.99 g, far past the grey-out limit. Widen it to 40 m and the g drops to 1 + \frac{784}{392.4} = 3.0 g, a hard but survivable load.
The third is building a circular loop. A circle has one radius, so the fast bottom and the slow top share it. The bottom then takes a punishing spike while the top barely holds the train on. The teardrop (clothoid) loop fixes this: it starts gently and tightens toward the top, where the train is slow. In the simulator the same ride peaks at 4.3 g with a 30 m teardrop and at 6.2 g with a circle. The widget above lets you feel the difference.
A crest can hurt too. If a hill crest has a very small radius and the train is fast, the negative g can drop below -1.5, and riders are flung hard against the restraints. Airtime is fun near -0.3 g; it is painful near -2 g.
Related tools on this site
If you like trading potential and kinetic energy, the Bottle Rocket Simulator runs the same bookkeeping upward against gravity and drag. For orbits, where the same energy law sets the shape of a transfer, try the Orbital Mission Planner. The Bridge Builder & Truss Simulator shows how the forces a coaster support must carry flow through steel, and the Linkage & Mechanism Simulator shows how cranks and linkages turn one motion into another.
Frequently asked questions
Why can't a later hill be taller than the lift hill?
Because the lift hill sets the total energy budget. At the top of the lift the train has gh joules per kilogram and nearly no speed. A later hill of the same height would need all that energy back as height, leaving no speed, and friction has already burned some away. So every hill must be lower than the lift, and each one lower than the last. With a launch instead of a lift, the launch speed sets the budget: a train at speed v can climb at most v^2 / (2g).
Does a heavier train go faster down the drops?
No. Mass cancels from the energy equation: both the kinetic and potential terms scale with m. Two trains of different mass follow the same speed and g-force curve, ignoring the small effect of friction and drag per kilogram. A full train and an empty one ride almost identically.
How many g can a rider actually take?
Vertical g pushes blood from the head toward the feet. Around 5 g held for more than a moment greys out vision, so designers keep valley loads at or below that; brief peaks are tolerated better than sustained ones. Negative g below about -1.5 presses riders hard into the lap bars and is limited too.
Why are modern loops teardrop-shaped?
A circle forces one radius everywhere, so the fast bottom suffers a huge g spike. Entering a 10 m-radius loop at 25 m/s gives 1 + \frac{625}{98.1} = 7.4 g at the bottom. A teardrop (clothoid) turns gently near the bottom to cut that peak near 4 g and tightens the slow top so the train still holds the rail. On the simulator's loop layout the difference is 4.3 g against 6.2 g.
Where does the lost energy go?
Into heat, through rolling friction in the wheels and air drag on the train. It never comes back. With the simulator's realistic friction, the Classic hills train has turned about a third of its energy into heat by the time it reaches the brakes, which is why each hill must be lower than the last. It still arrives at 82 km/h, which is why the ride needs a brake run at the end.
Related tools
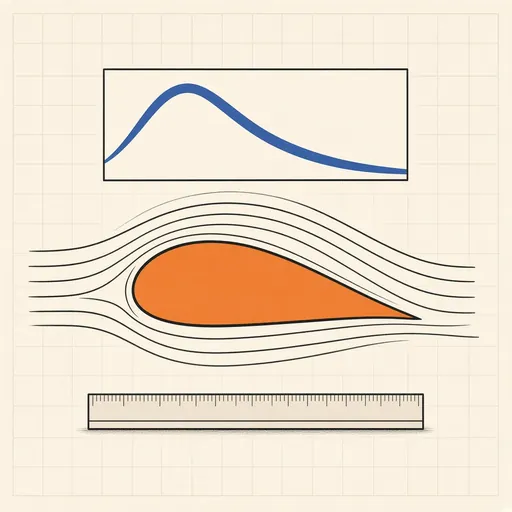
Airfoil Designer & Analyzer
Shape a NACA airfoil, see its pressure distribution and plot lift and drag polars, XFOIL-style, in the browser.
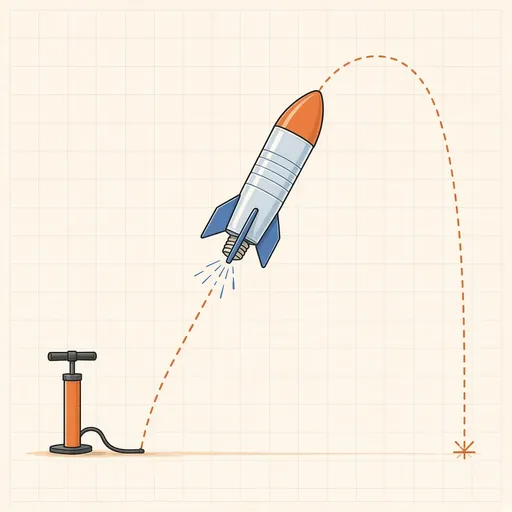
Bottle Rocket Simulator
Fill a soda-bottle water rocket, pump it up and launch it: find the water level, pressure and fins that fly highest.
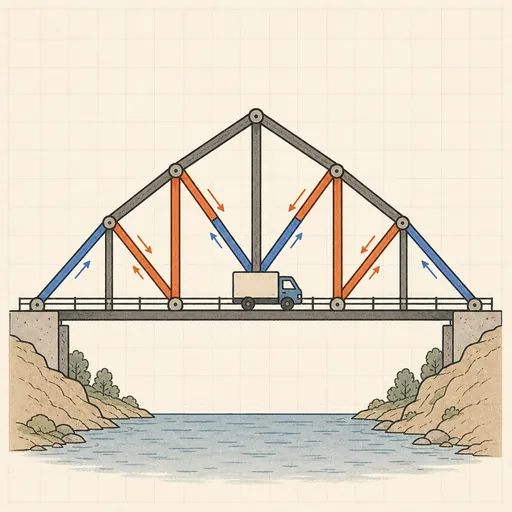
Bridge Builder & Truss Simulator
Design a truss bridge, send a truck across and watch every member strain, buckle or snap under load.
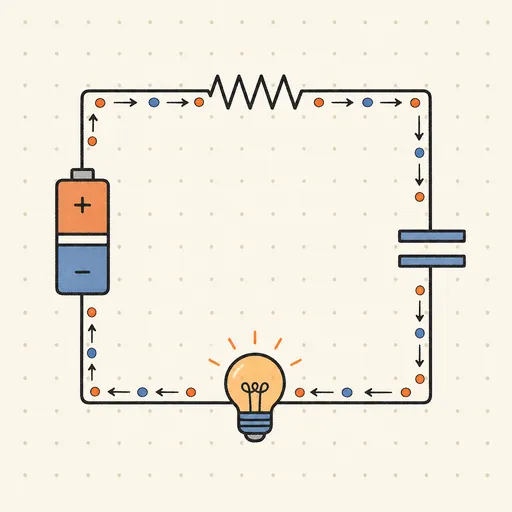
Circuit Simulator
Build analog circuits on a grid and watch current flow live — batteries, resistors, capacitors, LEDs and more.
Earthquake Shake Table Simulator
Shake a multi-story building with an earthquake and watch it sway, crack or survive, with base isolation and dampers.
Gear Generator
Design involute spur gears, racks and planetary sets, watch them mesh and export SVG or DXF for laser cutting.