Order Book and Market Maker, Explained
After reading this you will understand how a limit order book sets a price from nothing but order flow, how to compute slippage level by level, and why a market maker who earns the spread can still lose money.
What an order book is
An exchange does not know the "true" price of a stock. It only knows the orders people send. A limit order book is the ledger of those orders: every resting offer to buy sits on the bid side, every resting offer to sell sits on the ask side, and each is stamped with a price and a size.
Two prices matter most. The best bid is the highest price anyone will currently pay. The best ask is the lowest price anyone will currently accept. If the best bid is 99.98 and the best ask is 100.02, the gap between them, 0.04, is the spread. The midpoint, 100.00, is the mid-price, and it is the number the chart tracks.
Trades happen only when the two sides cross. A limit order joins the book and waits. A market order demands an immediate fill and eats resting orders on the opposite side, starting at the best price and walking outward until it is filled. That walk is where slippage lives.
No fundamental value appears anywhere in this model. The price you see is not tracking earnings or interest rates. It emerges entirely from who arrives and what they ask for, which is how microstructure economists model short-horizon prices.
When this model helps, and when it misleads
Use this simulator to build intuition about three things: how spread and depth relate to slippage, how random one-sided flow pushes a price around with no news at all, and how a market maker's inventory turns spread income into loss when flow trends.
Do not use it to predict a real price. Real markets have many correlated traders, latency games between machines, hidden orders, fees, and a fundamental value that anchors the price over hours and days. Here the arrivals are independent draws from a Poisson clock, order sizes are simple, and there is exactly one market maker. The mechanics are faithful. The realism stops at the mechanics.
The Poisson clock and the flow it produces
Traders arrive at random. The model uses a Poisson process with rate \lambda orders per second. The chance of exactly k arrivals in one second is:
Here \lambda is the arrival rate, k is a whole number of orders, and e \approx 2.71828. With \lambda = 5 you expect 5 orders per second, but any given second might bring 2 or 9. The waiting time between arrivals follows an exponential distribution with mean 1/\lambda, so at \lambda = 5 the average gap between orders is 0.2 seconds.
Each arriving order is then classified. With probability p_m it is a market order; otherwise it is a limit order that joins the book. A limit order picks a side (buy or sell) and a price near the current best. The market maker sits alongside all of this, refreshing quotes on both sides at a spread you set.
Slippage, computed level by level
Slippage is the gap between the price you saw and the average price you actually paid. A market buy fills against ask levels in order. Suppose the ask side holds these resting orders:
| Level | Price | Size | Cumulative size |
|---|---|---|---|
| 1 | 100.02 | 200 | 200 |
| 2 | 100.04 | 300 | 500 |
| 3 | 100.06 | 400 | 900 |
| 4 | 100.10 | 500 | 1400 |
A market buy of 700 shares consumes all of level 1 (200 at 100.02), all of level 2 (300 at 100.04), and 200 of level 3 (at 100.06). The total cost is:
The average fill price is 70028 / 700 = 100.04. The best ask before the trade was 100.02, so slippage is 100.04 - 100.02 = 0.02 per share, or 14 total. The new best ask is 100.06, because 200 shares still rest there. The book moved because you took liquidity out of it.
Slippage grows with order size and shrinks with book depth. Double the resting size at each level and the same 700-share order fills entirely at the first two prices, cutting slippage roughly in half. Depth is the cushion.
A worked example using the demo defaults
Load the demo (it uses the field defaults) and let the book run. The numbers below reproduce what the market maker does over a short one-sided burst.
Spread income versus inventory loss
Set the market maker to quote a spread of 0.04 around the mid, meaning it bids 0.02 below mid and asks 0.02 above. On a clean round trip (sell one share to an incoming buyer, then buy one back from an incoming seller) it earns the full spread of 0.04.
- Ten balanced trades pass through, five buys and five sells. The maker earns 10 \times 0.02 = 0.20 in half-spreads, netting
0.20with flat inventory. - Now flow turns one-sided: 20 market sells hit the maker's bid with no buys to offset. It buys 20 shares, each
0.02below mid, earning 20 \times 0.02 = 0.40 in half-spread income. - But the mid-price drifts down
0.30during that burst because every trade removed a bid level. The maker now holds 20 shares that are each worth0.30less than when bought. - Inventory loss is 20 \times 0.30 = 6.00. Spread income of
0.40does not come close. Net P&L on the burst is about 0.40 - 6.00 = -5.60.
This is the trap. The maker was paid to provide liquidity, and it still lost, because it accumulated a position on the losing side of a trend. Real desks answer this by skewing quotes: after buying too much, they lower both bid and ask to encourage sellers to look elsewhere and buyers to come in.
Reading the price wander and the flash crash
Watch the mid-price for a minute with balanced flow and you will see it drift up and down with no news. This is a random walk driven by which side happens to arrive more often. Over N independent trades that each nudge the mid by a step of size s, the typical distance the price has wandered grows like s\sqrt{N}, not like sN. After 100 trades with s = 0.01, expect a wander of roughly 0.01 \times \sqrt{100} = 0.10, not 1.00.
The flash-crash button breaks the pattern. It cancels the resting bids, so the book below the mid empties out. A single ordinary market sell then finds nothing at 99.98, nothing at 99.90, and fills far down the book at whatever price still has resting size. The price gaps in one tick. That is the mechanism behind the May 2010 flash crash: liquidity is a set of orders that can vanish in milliseconds, and when they vanish together, a modest order moves the price violently.
Common mistakes when reading the simulation
The first mistake is treating price moves as information. With balanced flow the mid still wanders. If you watch for 30 seconds and see the price up 0.15, that is almost certainly noise, not a signal. Check it against the random-walk estimate above before you read meaning into it.
The second is assuming the market maker profits because it earns the spread. It earns the spread only on round trips. When flow trends, it holds a growing position on the wrong side, and the worked example showed spread income of 0.40 swamped by an inventory loss of 6.00.
The third is thinking the quoted spread is the cost of trading a large order. The quote is the cost of the first share. A 700-share buy in the table above paid an average of 100.04, which is 0.02 worse than the 100.02 quote, so its real cost was the quote plus slippage.
Do not read the flash-crash price gap as a discovery of some lower true value. Nothing about value changed. Only the resting orders disappeared. When they return, the price snaps back, which is exactly what happened within minutes in 2010.
Related tools
If you like watching aggregate behavior emerge from simple local rules, several other simulations here scratch the same itch. The Economy Sandbox runs a miniature economy where GDP and inflation respond to your policy choices. The Auction Strategy Lab puts you inside four auction formats and introduces the winner's curse. The Wealth Inequality yard-sale model shows fair coin flips concentrating all wealth in one agent. For a supply-chain cousin of one-sided order flow, the Bullwhip Effect shows a small demand bump amplifying into a factory-scale swing. And the Tragedy of the Commons shows a shared resource collapsing under greedy extraction.
Frequently asked questions
Why does the price move when there is no news?
Because the model has no news. The mid-price is set by which orders arrive. If a few more buyers than sellers show up in a short window, they consume ask levels and lift the price. Over 100 trades of step 0.01 the typical wander is about 0.10, purely from randomness.
How is slippage different from the spread?
The spread is the gap between best bid and best ask, the cost of a single share done immediately. Slippage is the extra cost of a larger order that walks through multiple price levels. A 700-share buy against the demo book paid 0.02 per share above the quote in slippage, on top of crossing the spread.
Can the market maker guarantee a profit?
No. It profits on balanced flow because it captures the spread on round trips. On one-sided flow it accumulates inventory that loses value faster than the spread pays, as the worked example showed with a net of -5.60. Skewing quotes reduces this risk but does not remove it.
What exactly does the flash-crash button do?
It cancels the resting liquidity on one side of the book. The next market order then finds nothing at the usual prices and fills far down the book, gapping the price in a single tick. It mimics traders pulling their quotes at once, which is what turned a modest sell into a crash in May 2010.
Is Poisson arrival realistic?
It is a clean starting point, not the full picture. Real order arrivals cluster: activity begets activity, and one large order often triggers a burst of others. The Poisson clock captures the idea of random independent arrivals, which is enough to show wander, slippage and inventory risk, but it understates the bunching seen in live markets.
Related tools

Gerrymandering Sandbox
Draw the districts yourself and watch the same voters produce opposite election results.
Pareto Frontier Evolution
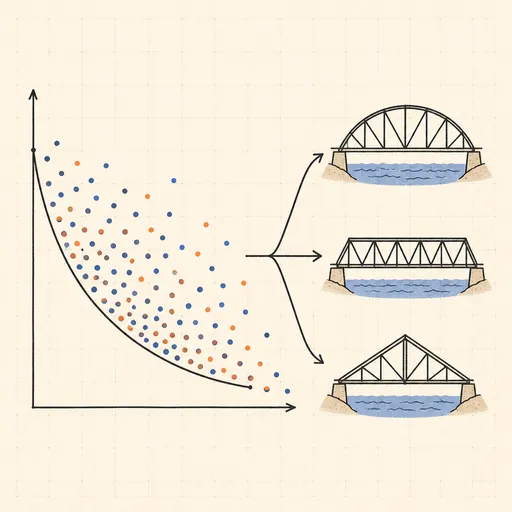
Watch a genetic algorithm breed bridge designs and trace out the weight-vs-stiffness Pareto frontier, generation by generation.

SIR Epidemic Simulator
Watch an epidemic spread and burn out with the classic susceptible–infected–recovered model.

Sailing & Tacking Simulator
Sail a boat against the wind — trim to the polar diagram, ride the shifts and race the optimal route.
Schelling’s Segregation Model
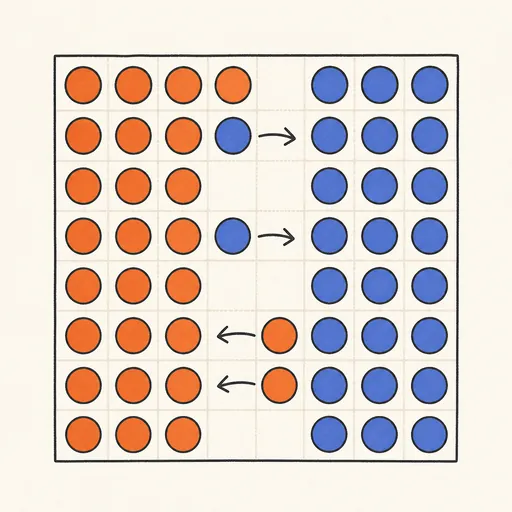
Give agents a mild preference for similar neighbours and watch a mixed city sort itself into stark blocks.

Traffic Jam Simulator
See phantom traffic jams appear from nothing on a ring road with the Nagel–Schreckenberg model.