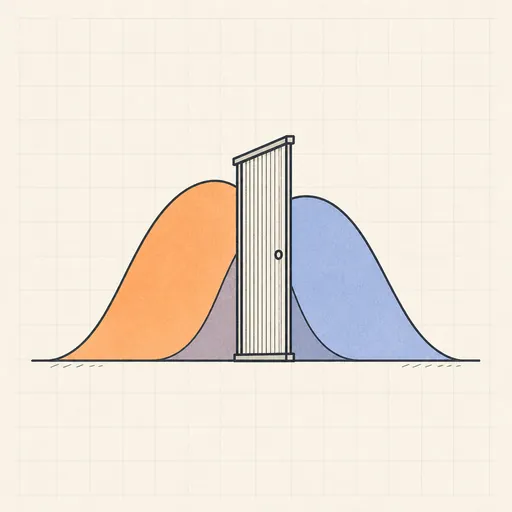
ROC & Threshold Explorer
A binary classifier reduces every example to a score, and a threshold turns scores into decisions. Two Gaussian score distributions — negatives in blue, positives in orange — follow your sliders for class separation d′, the spread of each class, prevalence and sample size, drawn both as smooth curves and as a histogram of an actual sample. Drag the vertical threshold line and every panel updates at once: the 2×2 confusion matrix recounts, the TPR, FPR, precision, recall, F1, specificity and accuracy readouts refresh, and the operating point slides along the ROC curve above the shaded AUC. Toggle the precision–recall view to see how prevalence changes the picture, then enter costs for false positives and false negatives to plot expected cost against threshold and find the marked optimum.
Runs 100% in your browser — models are trained and computed locally on your device.
Read the full guide to this tool
Notes
- AUC equals the probability that a randomly chosen positive scores higher than a randomly chosen negative; for two equal-variance Gaussians it is Φ(d′/√2).
- ROC curves ignore prevalence: TPR and FPR are computed within each class, so the curve does not move as the class ratio changes — but precision and the PR curve do.
- The cost-optimal threshold satisfies a likelihood-ratio condition: predict positive when p(x|+)/p(x|−) exceeds (c_FP/c_FN)·(1−π)/π, where π is the prevalence.
- Runs 100% in your browser — models are trained and computed locally on your device.
Related tools
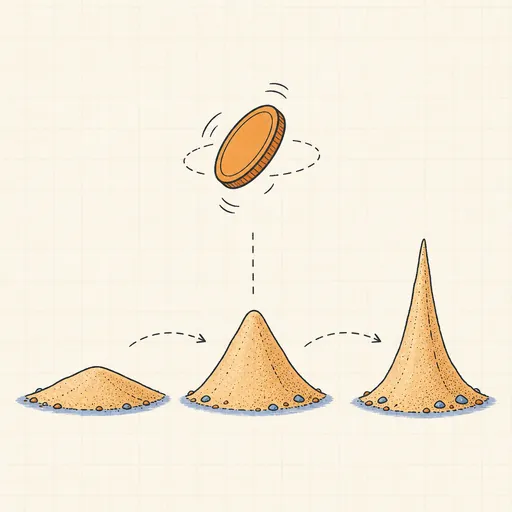
Bayesian Updating Visualizer
Flip a coin and watch a Beta prior morph into a sharpening posterior in real time.
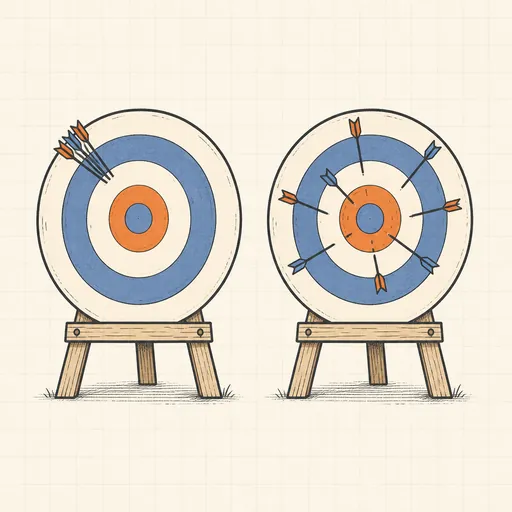
Bias–Variance Decomposition
See bias², variance and noise split a model’s error as 50 fits wobble around the truth.
Cross-Validation Visualizer
Animate k-fold splits and see why cross-validation beats a single train/test split.
Calibration & Reliability Diagram
Check whether predicted probabilities mean what they say, then fix them with temperature scaling.
Curse of Dimensionality
Watch distances concentrate and nearest neighbors fail as dimensions pile up.
Feature Scaling Demo
Run k-means and gradient descent on raw versus scaled features and watch scaling decide the outcome.