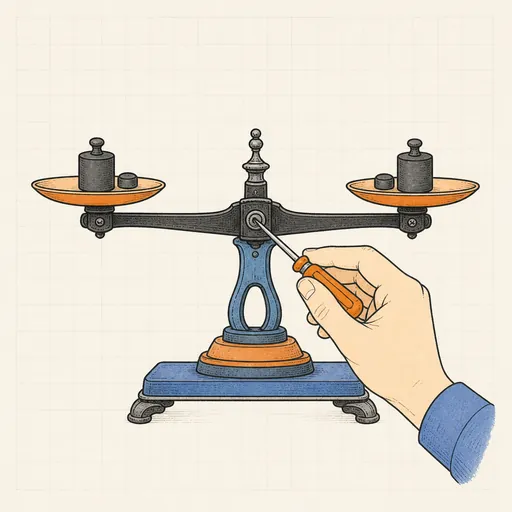
Calibration & Reliability Diagram
A classifier is calibrated when its probabilities mean what they say: of all predictions near 0.7, about 70% should turn out positive. This tool simulates a binary classifier by drawing true probabilities from a Beta distribution (skew slider), distorting them with a chosen miscalibration — overconfident, underconfident, calibrated or shifted, with a strength slider — and sampling outcomes. The reliability diagram bins the predictions and plots observed frequency against mean predicted probability; bars hugging the diagonal mean good calibration. A confidence histogram shows where predictions concentrate, and ECE and Brier score are reported live. Press "Fit temperature" to fit temperature scaling by a 1-D search on the negative log-likelihood: the recalibrated curve appears in green with its new ECE and Brier, and the fitted temperature tells you which way the model was off.
Runs 100% in your browser — models are trained and computed locally on your device.
Read the full guide to this tool
Notes
- Expected calibration error (ECE) is the bin-weighted average gap |observed frequency − mean confidence|; the Brier score is the mean squared error of the probabilities and decomposes into calibration, refinement and uncertainty terms.
- Temperature scaling divides the logit by a single scalar T before the sigmoid: T > 1 softens overconfident models, T < 1 sharpens underconfident ones, and accuracy never changes because the ranking is preserved.
- A one-parameter fix cannot repair a shifted classifier — miscalibration that is asymmetric around 0.5 needs Platt scaling or isotonic regression instead.
- Runs 100% in your browser — models are trained and computed locally on your device.
Related tools
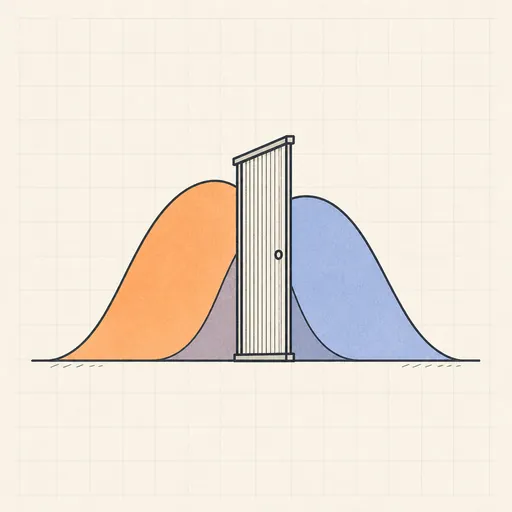
ROC & Threshold Explorer
Drag a decision threshold and watch the confusion matrix, ROC curve and expected cost respond in real time.
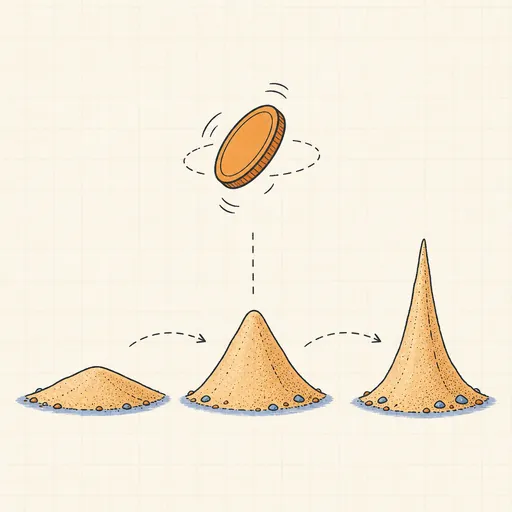
Bayesian Updating Visualizer
Flip a coin and watch a Beta prior morph into a sharpening posterior in real time.
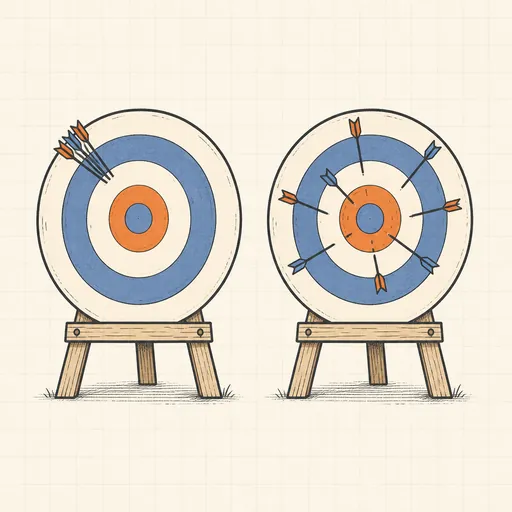
Bias–Variance Decomposition
See bias², variance and noise split a model’s error as 50 fits wobble around the truth.
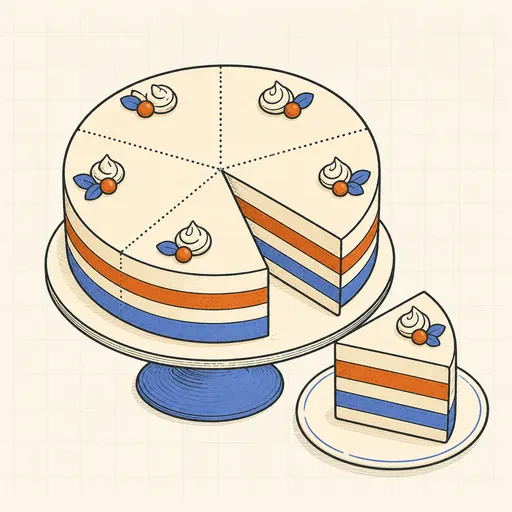
Cross-Validation Visualizer
Animate k-fold splits and see why cross-validation beats a single train/test split.
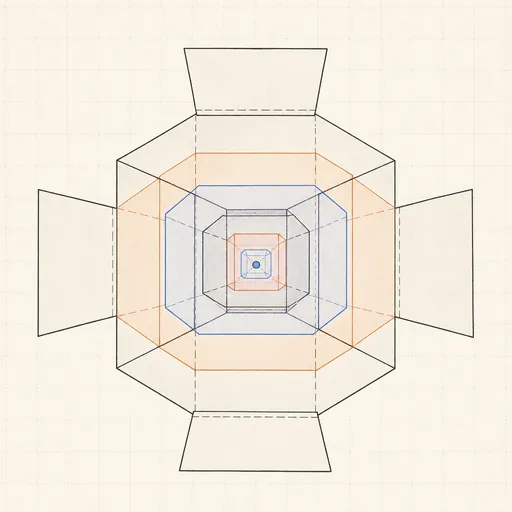
Curse of Dimensionality
Watch distances concentrate and nearest neighbors fail as dimensions pile up.
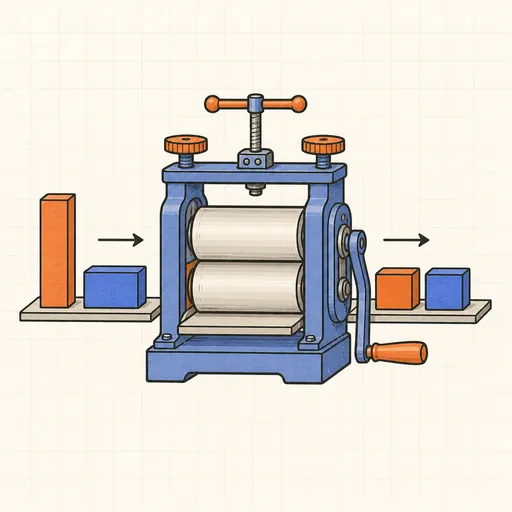
Feature Scaling Demo
Run k-means and gradient descent on raw versus scaled features and watch scaling decide the outcome.