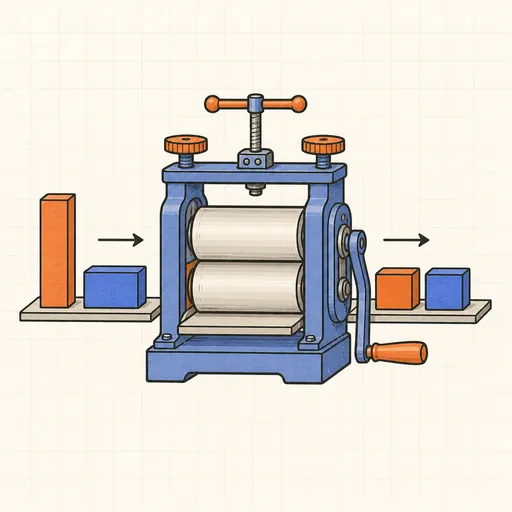
Feature Scaling Demo
Distance-based and gradient-based algorithms silently assume features share a scale. Here a two-cluster 2-D dataset has feature 2 stretched by a ratio you set between 1 and 1000, and two canvases run the same algorithm side by side on raw and scaled data. Choose k-means and watch the raw panel split points purely along the dominant axis while the scaled panel recovers the true clusters; choose gradient descent on linear regression and the loss contours become an elongated valley on the raw side — the descent path zigzags — versus near-circles on the scaled side, where it runs straight to the minimum. Compare standardization, min–max and robust (median/IQR) scaling, add outliers to see why robust exists, and read off iterations to converge and cluster accuracy for both panels.
Runs 100% in your browser — models are trained and computed locally on your device.
Read the full guide to this tool
Notes
- Standardization maps each feature to zero mean and unit variance; min–max maps to [0, 1]; robust scaling uses the median and interquartile range so a few outliers cannot dominate the statistics.
- Gradient descent converges at a rate set by the condition number κ of the Hessian — for linear regression κ grows with the squared scale ratio, and the largest safe learning rate shrinks as 1/λmax.
- Euclidean distance weights every unit equally, so a feature measured in grams instead of kilograms votes 1000× harder in k-means and k-NN.
- Decision trees and random forests split one feature at a time and are unaffected by monotone rescaling — scaling matters for k-NN, k-means, SVMs and anything trained by gradient descent.
- Runs 100% in your browser — models are trained and computed locally on your device.
Related tools
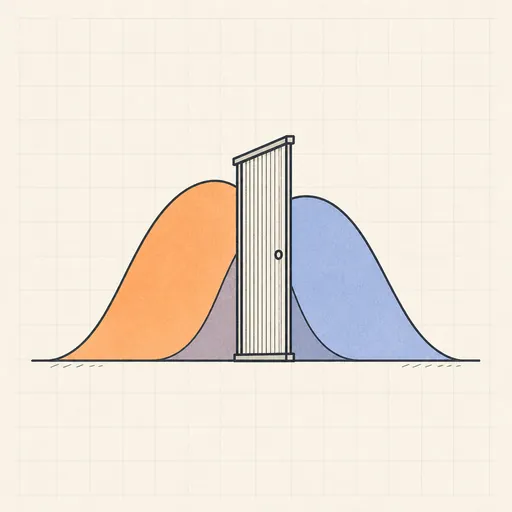
ROC & Threshold Explorer
Drag a decision threshold and watch the confusion matrix, ROC curve and expected cost respond in real time.
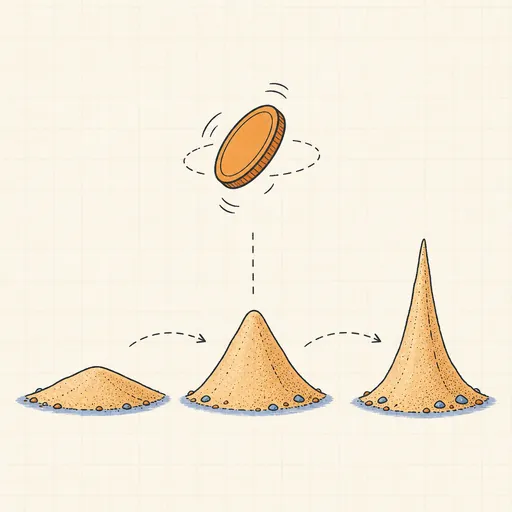
Bayesian Updating Visualizer
Flip a coin and watch a Beta prior morph into a sharpening posterior in real time.
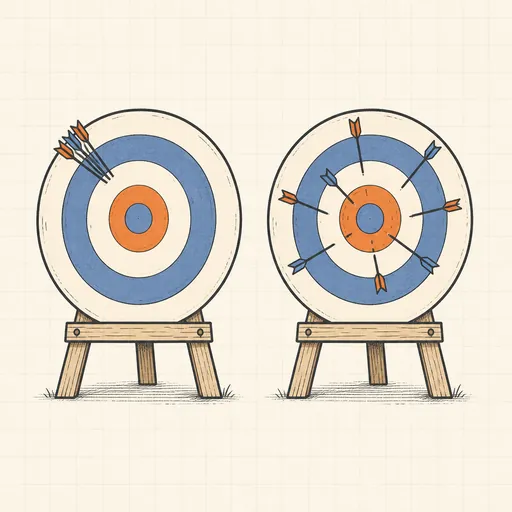
Bias–Variance Decomposition
See bias², variance and noise split a model’s error as 50 fits wobble around the truth.
Cross-Validation Visualizer
Animate k-fold splits and see why cross-validation beats a single train/test split.
Calibration & Reliability Diagram
Check whether predicted probabilities mean what they say, then fix them with temperature scaling.
Curse of Dimensionality
Watch distances concentrate and nearest neighbors fail as dimensions pile up.