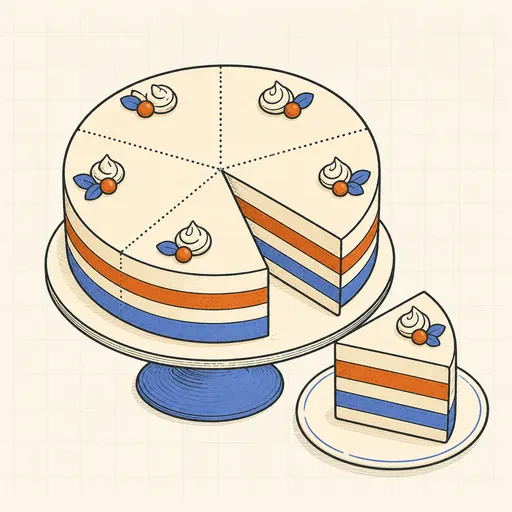
Cross-Validation Visualizer
How well will a model do on data it has never seen? K-fold cross-validation answers by cutting the training set into k parts, holding out each part once and averaging the k validation errors. The task here is polynomial regression on a noisy sine: pick the degree, the number of points and k (or press leave-one-out to set k = n), optionally shuffling before the split. Press Play and the folds animate: the strip of squares highlights the current validation fold in orange, the model refits on the rest, its curve redraws, and the fold’s MSE drops into a bar row. When all folds finish you get mean ± standard deviation, next to a histogram of 30 single 70/30 splits — showing how much luck-of-the-split variance a lone holdout hides.
Runs 100% in your browser — models are trained and computed locally on your device.
Read the full guide to this tool
Notes
- The CV estimate is nearly unbiased for a model trained on (k−1)/k of the data, so with small k it slightly pessimistically rates the final model trained on everything.
- Leave-one-out is the k = n extreme: almost unbiased, but the n fits are highly correlated, so the estimate itself can be noisy — k = 5 or 10 is the usual compromise.
- A single train/test split is an estimate built from one sample; repeating the split reveals a spread that is often wider than the gap between competing models.
- Runs 100% in your browser — models are trained and computed locally on your device.
Related tools
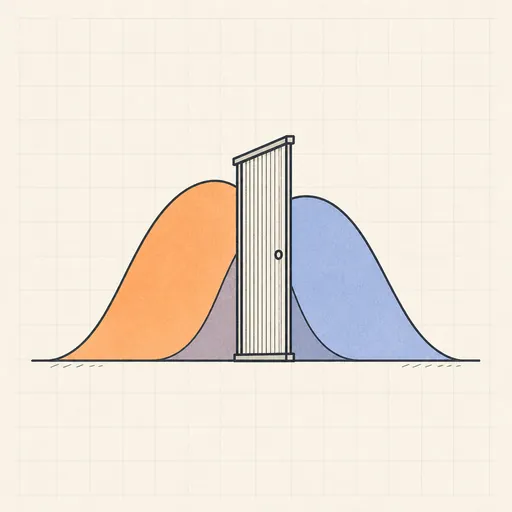
ROC & Threshold Explorer
Drag a decision threshold and watch the confusion matrix, ROC curve and expected cost respond in real time.
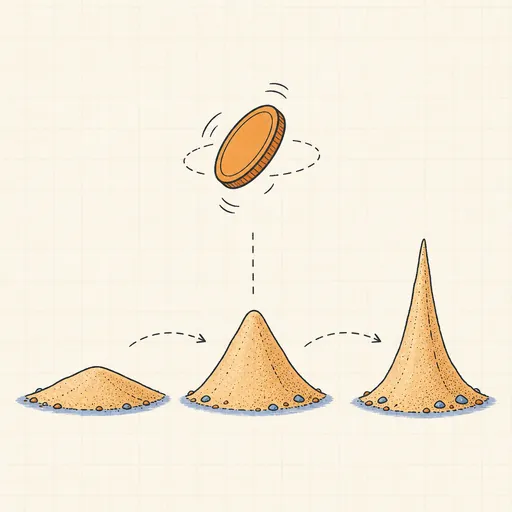
Bayesian Updating Visualizer
Flip a coin and watch a Beta prior morph into a sharpening posterior in real time.

Bias–Variance Decomposition
See bias², variance and noise split a model’s error as 50 fits wobble around the truth.
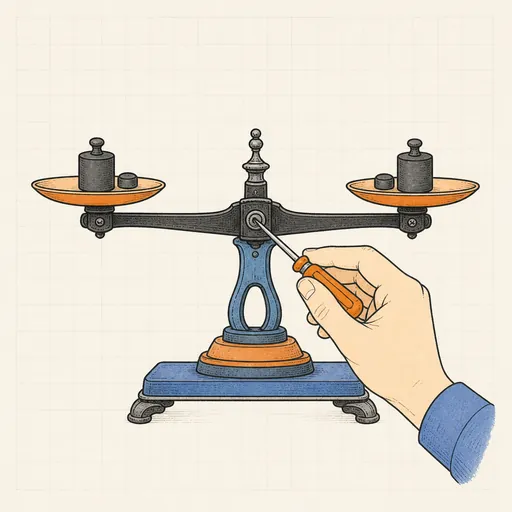
Calibration & Reliability Diagram
Check whether predicted probabilities mean what they say, then fix them with temperature scaling.
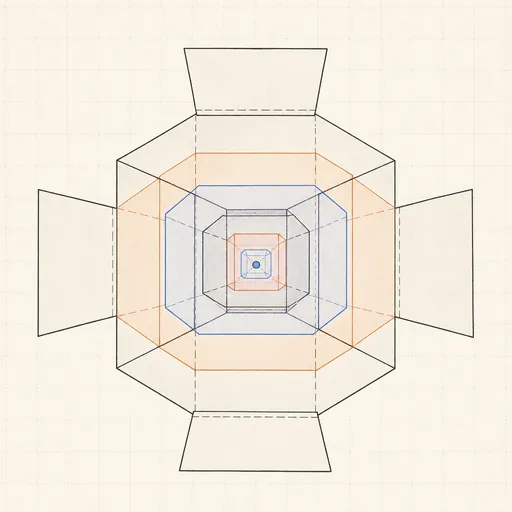
Curse of Dimensionality
Watch distances concentrate and nearest neighbors fail as dimensions pile up.
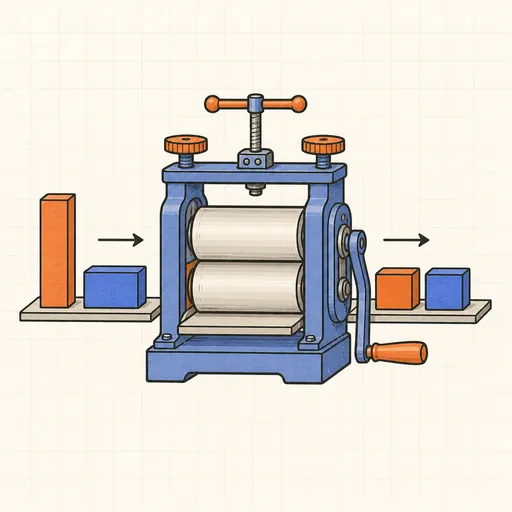
Feature Scaling Demo
Run k-means and gradient descent on raw versus scaled features and watch scaling decide the outcome.