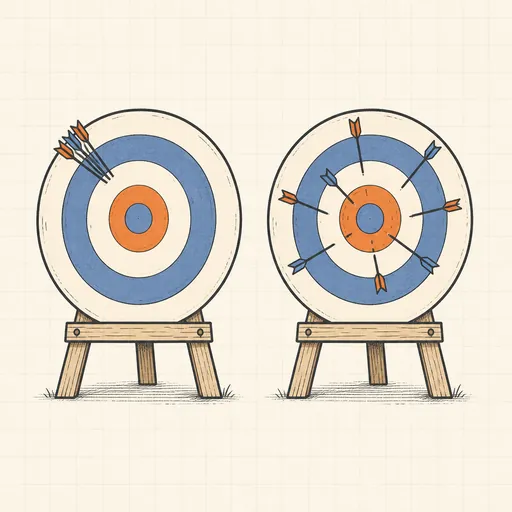
Bias–Variance Decomposition
Expected prediction error splits exactly into three parts: bias² (the average model misses the truth), variance (fits wobble across training sets) and irreducible noise. Pick a true function — sine, cubic or step — set the noise level and training-set size, then choose a model: polynomial regression with a degree slider or k-NN with a k slider. The tool draws 50 independent training sets and fits them all: individual fits appear as faint orange spaghetti, their average as a bold orange curve, the truth as a dashed blue line. Drag the green probe marker to read bias², variance and noise as a stacked bar at that x, and press Sweep to plot the full decomposition against model complexity — the classic U-shaped total error emerges as bias falls and variance rises.
Runs 100% in your browser — models are trained and computed locally on your device.
Read the full guide to this tool
Notes
- For squared loss the decomposition is exact and has no cross terms: E[(y − ŷ)²] = bias² + variance + σ².
- Low-degree polynomials (or large k in k-NN) underfit: high bias, low variance. High degree (or k = 1) overfits: bias vanishes but variance explodes.
- Variance is what regularization, bagging and more data reduce; bias only falls when the model class itself becomes more flexible.
- Runs 100% in your browser — models are trained and computed locally on your device.
Related tools
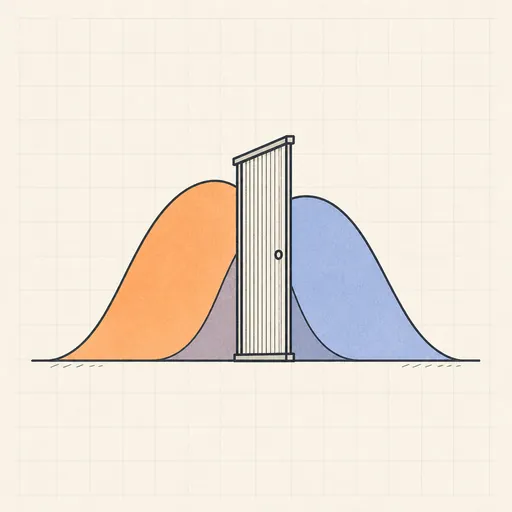
ROC & Threshold Explorer
Drag a decision threshold and watch the confusion matrix, ROC curve and expected cost respond in real time.
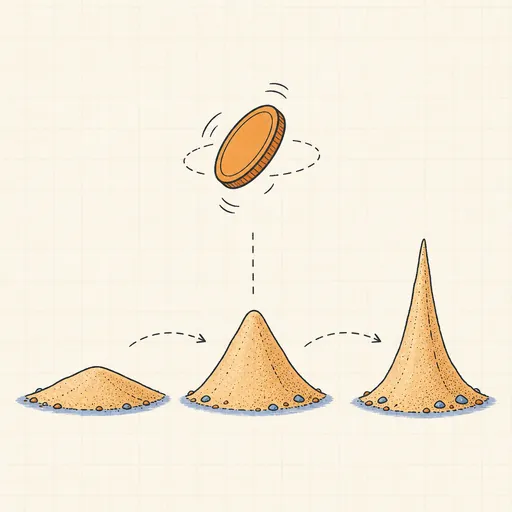
Bayesian Updating Visualizer
Flip a coin and watch a Beta prior morph into a sharpening posterior in real time.
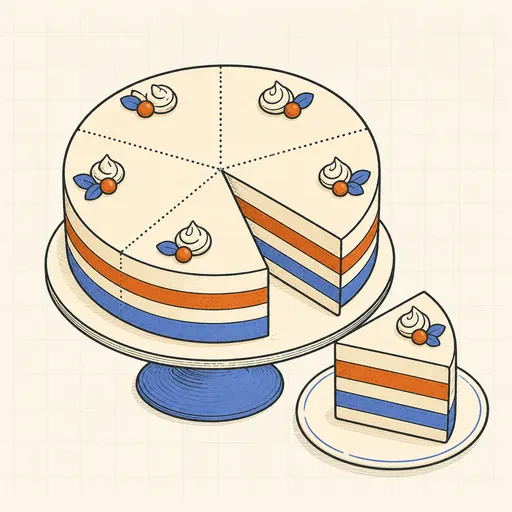
Cross-Validation Visualizer
Animate k-fold splits and see why cross-validation beats a single train/test split.
Calibration & Reliability Diagram
Check whether predicted probabilities mean what they say, then fix them with temperature scaling.
Curse of Dimensionality
Watch distances concentrate and nearest neighbors fail as dimensions pile up.
Feature Scaling Demo
Run k-means and gradient descent on raw versus scaled features and watch scaling decide the outcome.