Voronoi Diagrams and Lloyd Relaxation, Explained
After reading this you will be able to build a Voronoi diagram by hand from a handful of seed points, read its cell walls as perpendicular bisectors, and predict how Lloyd's relaxation nudges a ragged scatter into an even honeycomb.
What a Voronoi diagram is
Start with a scatter of points on the plane. Call them seeds. A Voronoi diagram answers one question for every location: which seed is closest? The set of all locations that pick the same seed forms one cell. Every seed owns exactly one cell, and the cells tile the plane with no gaps and no overlaps.
Here is the hook. Place two seeds, one at (0, 0) and one at (10, 0). The boundary between their cells is the vertical line x = 5. Any point with x \lt 5 is closer to the first seed, any point with x \gt 5 is closer to the second, and points on the line are tied. That line is the perpendicular bisector of the segment joining the two seeds. Every wall in a Voronoi diagram is a piece of a perpendicular bisector between two neighbouring seeds. That single fact explains the whole picture.
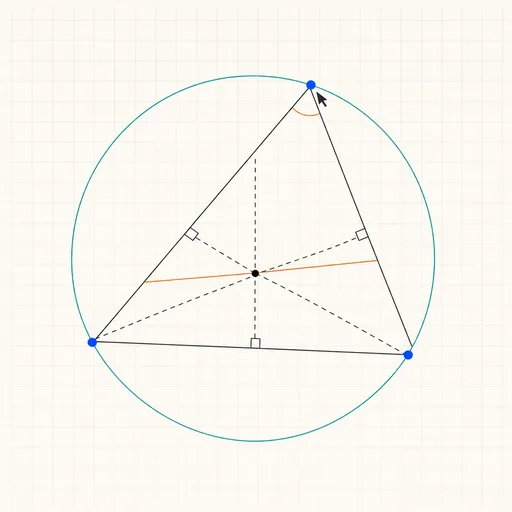
Add a third seed and you get three bisectors that meet at one point, the circumcentre of the triangle formed by the three seeds. That meeting point is a Voronoi vertex, and it is equidistant from all three seeds.
Where it is useful and where it is not
Voronoi diagrams answer nearest-neighbour questions directly. If seeds are cell-phone towers, each Voronoi cell is the region served by that tower under a closest-tower rule. If seeds are shops, each cell is the catchment area under a shortest-distance assumption. Biologists model packed cell tissue with them because real cells push against neighbours until they meet at flat shared walls, which is exactly what Voronoi cells do.
The dual structure, the Delaunay triangulation, connects seeds whose cells share a wall. It is the standard mesh for finite-element solvers because it avoids thin slivers: Delaunay triangles maximise the smallest angle across the mesh.
The closest-seed rule is a strong assumption. Real catchment areas depend on roads, prices, opening hours and habit, not straight-line distance. A Voronoi map of shops tells you the geometry of proximity, not where people actually shop. Treat it as a null model, not a forecast.
The distance and the cell definition
Fix a set of seeds p_1, p_2, \dots, p_n. The cell of seed p_i is every point at least as close to p_i as to any other seed.
Here x is any location, d is the distance function, and the condition must hold against every other seed p_j. With ordinary straight-line (Euclidean) distance,
where x = (x_1, x_2) and p = (p_1, p_2). Change this to the Manhattan metric |x_1 - p_1| + |x_2 - p_2| and the cell walls stop being straight bisectors: they bend into staircase shapes, because equal-distance sets under Manhattan distance are diamonds, not circles. Switching the metric is the fastest way to see how much the geometry depends on how you measure closeness.
Lloyd's relaxation, step by step
A random scatter gives lumpy cells: some huge, some tiny. Lloyd's relaxation evens them out. Each pass does one thing to each seed: move it to the centroid (the centre of mass) of its own cell.
Here A_i is the area of cell i, the integral sums the position x over every point of the cell, and dividing by the area gives the average position. In practice the tool computes this centroid from the cell polygon. After moving every seed, it rebuilds the diagram and repeats.
Each pass shrinks a quantity called the energy: the sum over all cells of the squared distance from cell points to their seed.
Moving a seed to its cell centroid is exactly the move that minimises that cell's contribution to E, because the centroid is the point that minimises mean squared distance. So E never rises. It falls until seeds sit at their own centroids. That fixed point is a centroidal Voronoi tessellation, and its cells look like an even honeycomb.
A worked example with five seeds
Relaxing five seeds in a 10 by 10 square
Take five seeds inside a square from (0, 0) to (10, 10): A = (2, 2), B = (8, 3), C = (5, 5), D = (3, 8), E = (9, 9). The total area is 100, so the mean cell area is 20 and will stay 20 at every step, because the five cells always fill the same square.
- Build the diagram. The wall between
AandCis the perpendicular bisector of the segment from(2, 2)to(5, 5). Its midpoint is(3.5, 3.5)and the segment has slope1, so the wall has slope-1through that midpoint: the line x_1 + x_2 = 7. - Measure cell areas. Seed
Cat the centre owns a small cell of roughly13square units, while corner seedEowns a large cell of roughly30. The spread is wide: standard deviation near7.3, so the coefficient of variation is about7.3 / 20 = 0.365, or 37 percent. - One Lloyd pass. Compute each cell centroid and move the seed there. Corner cells pull their seeds inward, so
Eslides from(9, 9)toward roughly(8.1, 8.1). The interior seedCbarely moves. - Rebuild and measure again. Areas now range from about
16to24. Standard deviation drops to near3.1, so the coefficient of variation falls to about0.155, or 16 percent. - Repeat. After about ten passes the five cells settle near
20each, standard deviation under1.5, and the seeds sit in a tidy pattern: four near the corners of an inner square, one in the middle.
You can reproduce this by placing the five points, reading off the cell areas, and stepping the relaxation. The mean stays pinned at 20 the whole time. Only the spread changes.
Reading the diagram and its dual
Three things are worth reading off any Voronoi picture.
- Cell size
- A large cell means an isolated seed with no close neighbours. Under relaxation, large cells shrink and small cells grow toward the mean.
- Wall count
- The number of walls of a cell equals its number of Delaunay neighbours. In a relaxed 2D tessellation most cells settle on six walls, which is why the result looks like a honeycomb. That six is not a coincidence: a regular hexagon is the shape that tiles the plane with the lowest energy E per unit area.
- Vertices
- Each Voronoi vertex is equidistant from the three seeds around it and is the centre of a circle through those three seeds that contains no other seed. That empty-circle property is the definition of a Delaunay edge.
Turn on the Delaunay overlay and you see the dual graph: a line joins two seeds exactly when their cells touch. Every triangle in that mesh corresponds to one Voronoi vertex. The two pictures carry the same information in two forms.
Common mistakes
The first mistake is expecting relaxation to change the mean cell area. It cannot. The cells always fill the whole region, so their areas always average to the region area divided by the seed count. Relaxation only redistributes area, never total.
The second mistake is forgetting the boundary. Seeds near the edge have cells that would run off to infinity if the region were unbounded. The tool clips cells to the frame, which drags edge centroids inward and makes edge seeds crawl toward the middle on every pass. If you want a stable interior pattern, ignore the outermost ring of cells or wrap the space so it has no edge.
To check convergence, watch the total distance seeds move in one pass. Early passes move seeds a lot: in the five-seed example the first pass moves E about 1.3 units. By pass ten the largest move is under 0.05 units. When the biggest move drops below a small threshold, the tessellation has effectively converged and more passes buy you almost nothing.
The third mistake is assuming Lloyd's relaxation reaches a unique answer. It does not. Different starting scatters converge to different centroidal tessellations, all with the same mean area but different exact seed positions. The algorithm finds a local minimum of the energy, not the global one.
Related tools
Voronoi diagrams sit among other rule-driven pattern generators on this site. For grid-based rules where each cell updates from its neighbours, see Conway's Game of Life and its one-dimensional cousin Elementary Cellular Automata. For another way seeds grow into a packed floral pattern, compare the golden-angle placement in Phyllotaxis, whose sunflower head is nearly a centroidal tessellation by construction. To see a smooth field version of blobs merging instead of hard cell walls, try Metaballs. And for randomness producing structure from repetition, the jump-to-a-corner rule in Chaos Game mirrors how repeated relaxation steps carry disorder toward order.
Frequently asked questions
Why do relaxed Voronoi cells look like hexagons?
Among tilings of the plane, the regular hexagon minimises boundary length per unit area and minimises the Lloyd energy per unit area. Relaxation drives seeds toward that minimum, so most cells end up with six neighbours. Curved boundaries and edges keep it from being perfect, but six is the typical wall count.
Does Lloyd's relaxation always converge?
Yes, in the sense that the energy E is bounded below and never increases, so it settles. It converges to a centroidal tessellation, but which one depends on where you start. There is no single answer, only many local ones with the same mean cell area.
What is the Delaunay triangulation for?
It is the dual graph of the Voronoi diagram: connect two seeds when their cells share a wall. Because Delaunay triangles avoid thin slivers by maximising the smallest angle, they are the default mesh for physical simulations and terrain models.
Can I change how distance is measured?
Yes. Under Euclidean distance the walls are straight bisectors. Under Manhattan distance the equal-distance sets are diamonds, so walls bend into staircases and some cells even become disconnected. The metric decides the geometry entirely.
How many seeds should I use?
Enough that interior cells outnumber edge cells, so the boundary does not dominate. With 30 to 60 seeds in a square, the middle of the frame relaxes into a clean honeycomb while the outer ring stays distorted by clipping.
Related tools
3D Geometry Board
Points, lines, planes, spheres and polyhedra on an orbiting camera — slice solids with planes, unfold nets, drop the Dandelin spheres into a cone and drag everything.
Bézier Curve Playground
Drag control points and watch De Casteljau’s algorithm construct a Bézier curve step by step.
Central Limit Theorem Demo
Sample from any lopsided distribution and watch the averages pile up into a bell curve.
Conway’s Game of Life
Paint cells and watch Conway’s cellular automaton breed gliders, guns and oscillators.
Dynamic Geometry Board
Construct with points, lines, circles and transformations, then drag anything — the construction stays true, and a checker tells you which relations are theorems.
Fantasy Map Generator
Roll a seed and get a continent: coastlines, mountains, rivers, biomes and named towns, ready for your campaign.