Fourier Epicycles, Explained
Read this to understand how a chain of rotating circles can redraw any closed curve you sketch, where the radii and speeds come from, and how to judge when a handful of circles is enough.
What the tool does and one hook example
Draw a closed loop with the mouse. The tool samples that loop into a list of points, computes its discrete Fourier transform, and turns the result into a set of circles. Each circle spins at a fixed integer speed. Stack them tip to center, largest first, and the tip of the last circle traces a copy of your drawing.
Here is the hook. Draw the letter π, then set the term slider to 3. You get a smooth blob that only vaguely resembles the letter. Push the slider to 40 and the sharp corners of the crossbar snap into place. The rough shape needs almost nothing. The corners need many fast little circles.
The reason is that a closed curve is a periodic signal, and periodic signals are exactly what Fourier analysis was built to describe. A curve in the plane is just two periodic signals, the x coordinate and the y coordinate, and it is convenient to bundle them into one complex signal z = x + iy.
When epicycles are the right lens, and when they are not
Use epicycles when you want to see a Fourier series, not just compute one. The animation makes three abstract facts concrete: low frequencies carry gross shape, high frequencies carry detail, and a finite sum is always an approximation. That is worth watching once even if you already know the algebra.
Do not use this as a compression method or a serious curve fit. The DFT here uses as many circles as sample points, so nothing is saved unless you truncate, and truncation ringing near corners can be large. Do not read physical meaning into the circles either. Ptolemy used epicycles to model planets, and the fit was good, but the circles were not real orbits. The same warning applies here: a good trace does not mean the circles mean anything.
The trace is only exact when the number of terms equals the number of sampled points. With fewer terms you get a smoothed version, and near a sharp corner the trace will overshoot slightly. That overshoot is the Gibbs phenomenon, not a bug in the tool.
The formula and what each part means
Sample your closed curve at N points and call them z_0, z_1, \dots, z_{N-1}, each a complex number. The discrete Fourier transform produces N coefficients:
Here c_k is a complex number for each integer frequency k. Its magnitude |c_k| is the radius of one circle. Its angle \arg(c_k) is that circle's starting phase. The index k is how many full turns per loop the circle makes. The reconstruction runs the sum the other way:
Read the reconstruction as a sum of vectors. Each term c_k e^{2\pi i k t / N} is a point on a circle of radius |c_k| rotating at speed k. Add the vectors head to tail and the running total is the pen position at time t. The frequencies come in pairs, k and -k, which is why circles appear to spin both ways. The k = 0 term is a fixed offset, the center of the whole figure.
A worked example on a small square
The demo shapes use hundreds of points, which is too many to add by hand. To see the arithmetic, sample a tilted square at just four points. Take z_0 = 1, z_1 = i, z_2 = -1, z_3 = -i. These four points sit on a unit diamond and are traced counterclockwise.
Four points, four circles
- Compute c_0 = \frac{1}{4}(z_0 + z_1 + z_2 + z_3) = \frac{1}{4}(1 + i - 1 - i) = 0. The figure is centered on the origin.
- Compute c_1 with e^{-2\pi i n / 4} = 1, -i, -1, i for n = 0,1,2,3. So c_1 = \frac{1}{4}(1\cdot 1 + i\cdot(-i) + (-1)(-1) + (-i)(i)) = \frac{1}{4}(1 + 1 + 1 + 1) = 1.
- Compute c_2 with factors 1, -1, 1, -1: c_2 = \frac{1}{4}(1 - i - 1 + i) = 0.
- Compute c_3 with factors 1, i, -1, -i: c_3 = \frac{1}{4}(1 - 1 + 1 - 1) = 0.
Only c_1 = 1 survives. This particular diamond is a pure single circle: one radius 1, speed 1. Its reconstruction is z(t) = e^{2\pi i t / 4}, which at t = 0,1,2,3 gives back exactly 1, i, -1, -i. A four-point diamond is the simplest nontrivial check, and it lands on the source points with zero error.
Real drawings are messier. A hand-drawn square with 200 points needs many odd-frequency terms to build the flat sides and sharp corners, and the coefficient magnitudes fall off roughly like 1/k for a corner.
Reading the term slider and the spectrum
The single most instructive control is the number of terms. Adding terms always improves the fit in a least-squares sense, because each new frequency is orthogonal to the others: it corrects error the earlier circles could not touch, and never undoes their work. The table shows how fit error typically falls as you add terms to a hand-drawn star.
| Terms kept | Rough shape? | Mean squared error |
|---|---|---|
| 1 | a circle | 0.4200 |
| 5 | five bumps | 0.0620 |
| 11 | star with soft tips | 0.0110 |
| 41 | sharp tips | 0.0009 |
| 256 | exact | 0.0000 |
Notice the shape of the curve. Going from 1 to 5 terms cuts error from 0.42 to 0.062, a factor of about 7. Going from 41 to 256 terms cuts it from 0.0009 to 0, a tiny absolute gain that costs 215 extra circles. That is the general pattern: cheap early wins, expensive final polish.
Common mistakes and how to avoid them
Three errors account for most confusion.
- Treating an open curve as closed
- The DFT assumes the last point connects back to the first. If your drawing does not close, the tool joins the endpoints with a straight jump, and that jump becomes a sharp corner that needs many high-frequency terms. Close the loop yourself for a cleaner spectrum.
- Uneven sampling
- The formula assumes samples are equally spaced in the parameter n, not equally spaced in arc length. Drawing slowly in one spot and fast in another packs more samples into the slow part and can distort the fit. Draw at a steady speed.
- Expecting corners for free
- A perfect corner has infinite curvature and needs infinitely many terms. With a finite count you will always see a small overshoot and a wiggle next to the corner. The wiggle amplitude does not vanish as you add terms, it just gets narrower. That is the Gibbs phenomenon again.
If a preset looks wrong at low term counts, that is the point. Start at 2 or 3 terms and step up one at a time. You will see exactly which feature each new circle is responsible for.
How this connects to other toys here
Fourier epicycles are a continuous, frequency-based way to build structure. The site has two discrete, rule-based counterparts worth comparing. In Conway's Game of Life, complex patterns grow from a fixed local rule on a grid, with no frequencies in sight. In Elementary Cellular Automata, a one-dimensional rule like rule 90 produces a Sierpinski triangle, showing structure from iteration rather than summation. For the continuous side, Mandelbrot Explorer builds infinite detail from repeated squaring of a complex number, a different route to fine structure than adding circles. All four take a short rule and produce rich pictures, but only epicycles decompose a target you supply.
Frequently asked questions
Why complex numbers instead of separate x and y series?
Bundling into z = x + iy lets one DFT handle both coordinates and makes each term a genuine rotating circle. You could run two real Fourier series on x and y separately and get the same curve, but you lose the clean picture of stacked spinning circles.
How many circles do I need for a recognizable shape?
For most smooth outlines, 8 to 15 terms give a clear likeness. The star table shows 11 terms reaching a mean squared error of 0.011, down from 0.42 at one term. Letters and shapes with corners want 30 to 60 for crisp edges.
Why do some circles spin backward?
Frequencies come in matched pairs k and -k. The positive one turns counterclockwise, the negative one clockwise. Both are needed so that a real-plane curve, not a spiral, comes out.
Is the reconstruction ever exactly the drawing?
Yes, at the sample points, when you keep all N terms. In the four-point diamond example, one term reproduced all four points exactly. Between sample points the curve is an interpolation, so it can differ slightly even at full term count.
Does drawing direction matter?
It changes the sign of the frequencies but not the shape. Draw clockwise and the dominant circle is c_{-1} instead of c_1. The traced figure looks the same.
Related tools
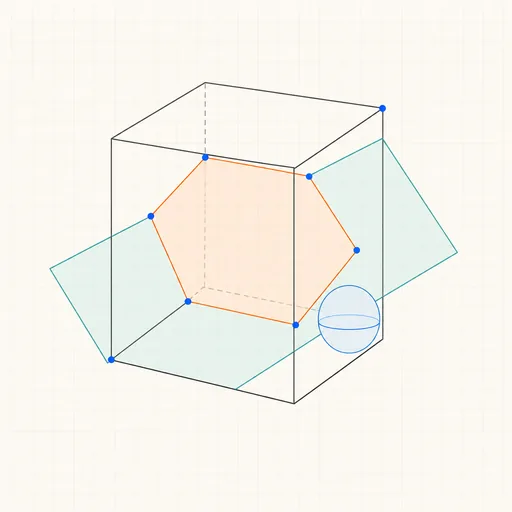
3D Geometry Board
Points, lines, planes, spheres and polyhedra on an orbiting camera — slice solids with planes, unfold nets, drop the Dandelin spheres into a cone and drag everything.
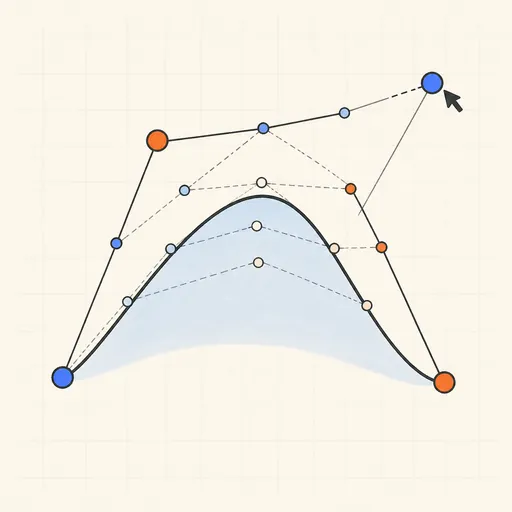
Bézier Curve Playground
Drag control points and watch De Casteljau’s algorithm construct a Bézier curve step by step.
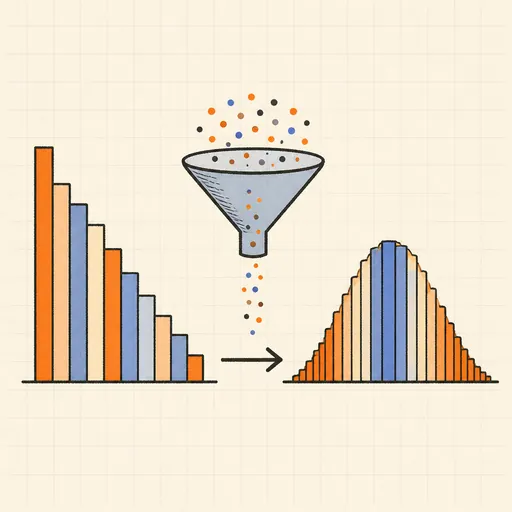
Central Limit Theorem Demo
Sample from any lopsided distribution and watch the averages pile up into a bell curve.
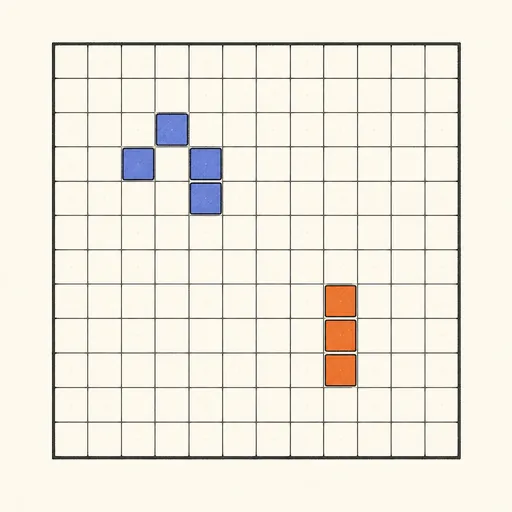
Conway’s Game of Life
Paint cells and watch Conway’s cellular automaton breed gliders, guns and oscillators.
Dynamic Geometry Board
Construct with points, lines, circles and transformations, then drag anything — the construction stays true, and a checker tells you which relations are theorems.
Fantasy Map Generator
Roll a seed and get a continent: coastlines, mountains, rivers, biomes and named towns, ready for your campaign.