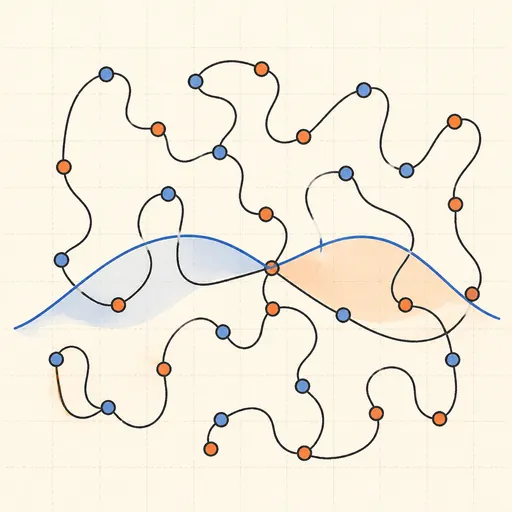
Overfitting Sandbox
Fit polynomials of degree 0 to 15 to noisy samples from a hidden function and watch underfitting turn into overfitting. Pick the true curve (sine, step or cubic), the noise level and the sample size; the sandbox splits the data 70/30 into filled training points and hollow test points, fits the chosen degree by least squares on Chebyshev-scaled features, and draws the fitted curve over the dashed truth. Drag the degree up and watch the curve chase every training point while swinging wildly between them; press Sweep degrees and the lower chart traces train and test error across all degrees — the classic U-shaped test curve whose minimum marks the sweet spot. A verdict line calls out underfit, good fit or overfit.
Runs 100% in your browser — models are trained and computed locally on your device.
Read the full guide to this tool
Notes
- Training error falls (weakly) as degree grows, but test error is U-shaped — the bias–variance tradeoff in one chart.
- Test MSE can never reliably beat the noise floor σ²: once the true curve is captured, what remains is irreducible noise.
- Fitting uses a Chebyshev polynomial basis on [−1, 1]; raw powers x¹⁵ would make the normal equations catastrophically ill-conditioned.
- A degree-n polynomial can interpolate n + 1 training points exactly — high degrees will happily fit pure noise.
- Runs 100% in your browser — models are trained and computed locally on your device.
Related tools
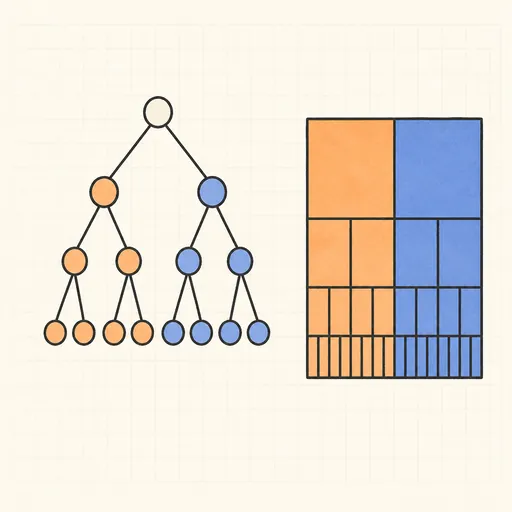
Decision Tree Builder
Grow a CART decision tree split by split and watch the partition map and tree diagram build together.
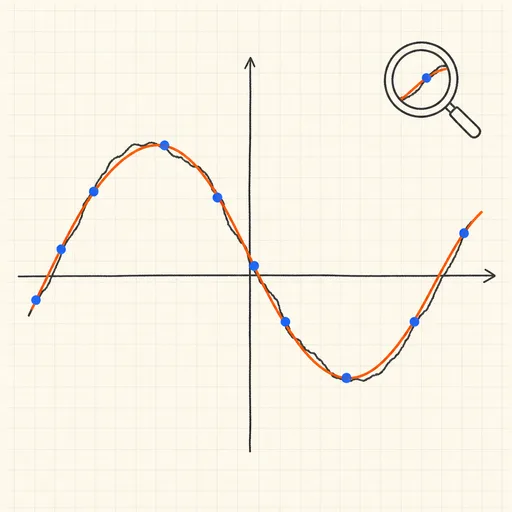
Function Sketch Finder
Sketch a curve on a zoomable coordinate grid and search dozens of function families for the equations that fit it best.
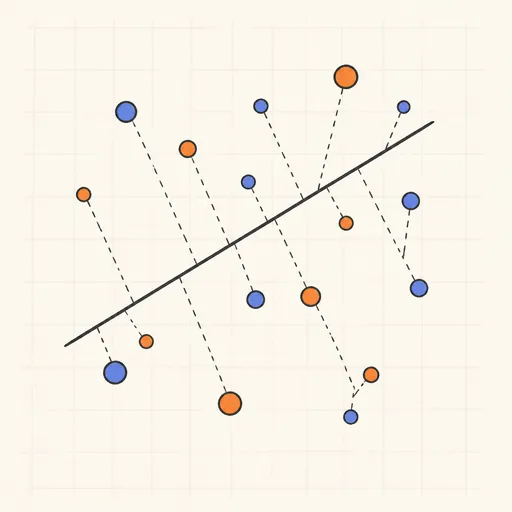
Linear Regression Playground
Place points, watch the least-squares line follow, and see gradient descent crawl across the loss surface.
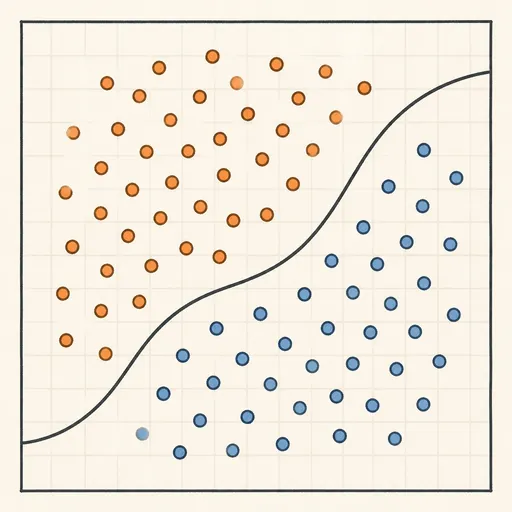
Logistic Regression Playground
Paint two classes of points and watch logistic regression carve out its probability boundary by gradient descent.

Naive Bayes Classifier Demo
Score your own message with a word-count spam filter, or watch Gaussian naive Bayes classify 2D points.
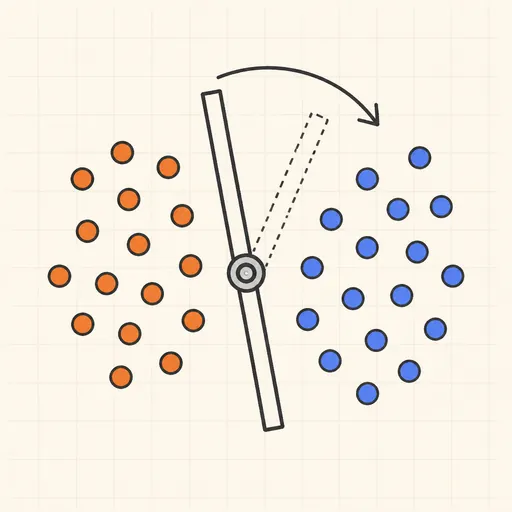
Perceptron Learning Animation
Step through Rosenblatt’s 1958 learning rule and watch the decision boundary rotate with every mistake.