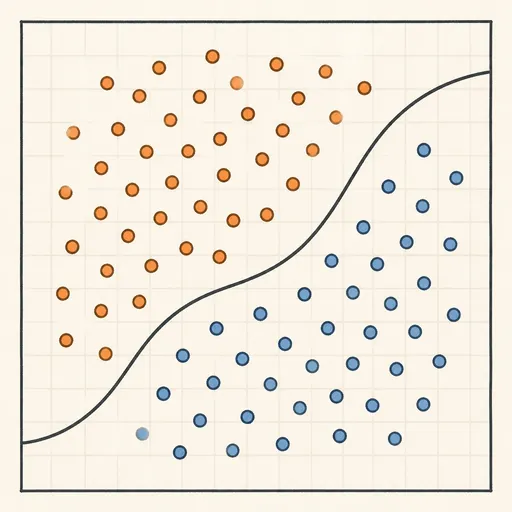
Logistic Regression Playground
Logistic regression models the probability of class membership as σ(w·x + b), the sigmoid of a linear score, trained by gradient descent on the cross-entropy loss. Paint blue and orange points with the class selector or load presets — cleanly separable blobs, overlapping clouds, or a circle nested inside a ring — then press Play: each epoch the probability heatmap re-shades from blue to orange and the 0.5 decision line moves. A learning-rate slider controls the step size, an L2 slider shrinks the weights to tame overconfident fits, and a degree-2 polynomial-features toggle adds x², xy and y² so the linear model can bend into an ellipse and solve the circular dataset. Epoch, loss and accuracy are reported live above a training-loss curve.
Runs 100% in your browser — models are trained and computed locally on your device.
Read the full guide to this tool
Notes
- The cross-entropy gradient takes the same form as linear regression’s: ∇w is the mean of (σ(w·x + b) − y)·x — exactly what each animated epoch applies.
- On perfectly separable data unregularised logistic regression never settles: the weights grow without bound as the sigmoid chases hard 0/1 outputs; L2 regularisation caps them.
- The decision boundary is exactly the curve w·x + b = 0 — a straight line with raw features, a conic section with degree-2 polynomial features; the heatmap’s colour strength shows the model’s confidence.
- Runs 100% in your browser — models are trained and computed locally on your device.
Related tools
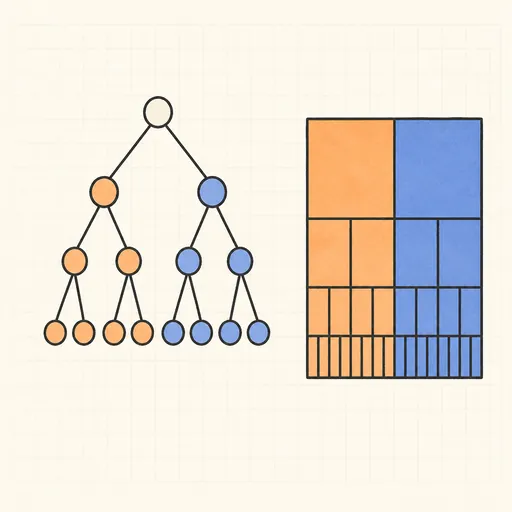
Decision Tree Builder
Grow a CART decision tree split by split and watch the partition map and tree diagram build together.
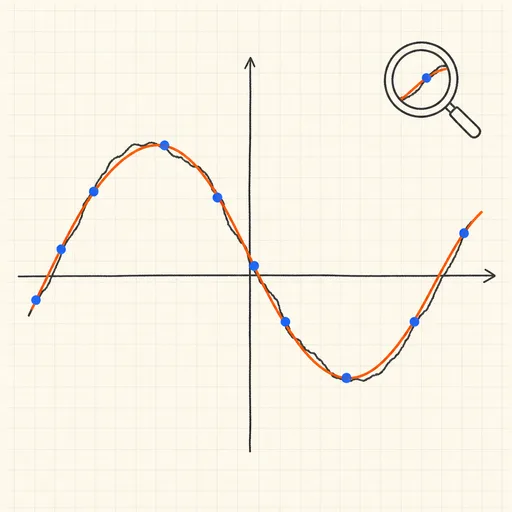
Function Sketch Finder
Sketch a curve on a zoomable coordinate grid and search dozens of function families for the equations that fit it best.
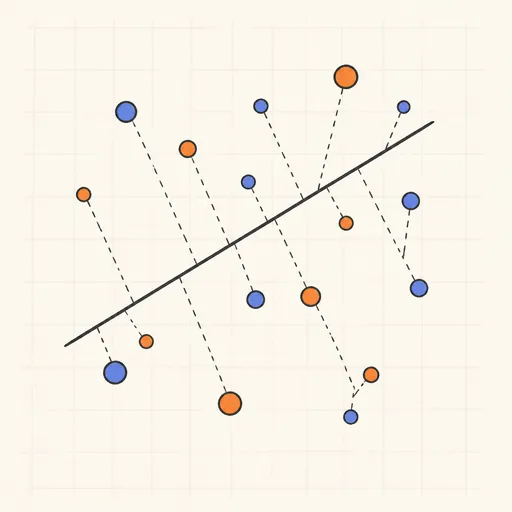
Linear Regression Playground
Place points, watch the least-squares line follow, and see gradient descent crawl across the loss surface.
Overfitting Sandbox
Crank a polynomial’s degree on noisy data and watch the train/test error curves split apart.

Naive Bayes Classifier Demo
Score your own message with a word-count spam filter, or watch Gaussian naive Bayes classify 2D points.
Perceptron Learning Animation
Step through Rosenblatt’s 1958 learning rule and watch the decision boundary rotate with every mistake.