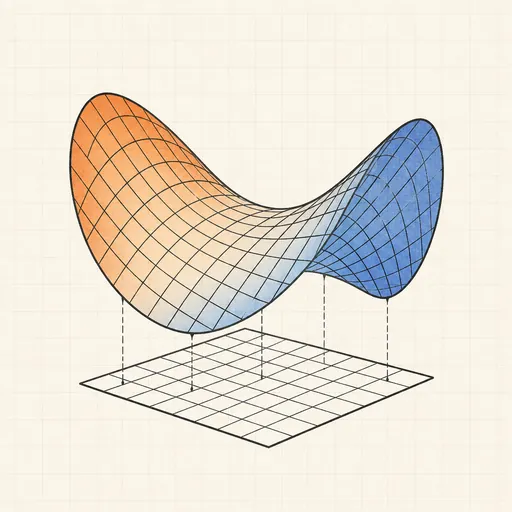
3D Surface Plotter
Functions of two variables are surfaces, and intuition for them comes from rotating them in your hands. This plotter renders classic surfaces — the saddle x² − y², the ripple sin(r)/r, a Gaussian peak, the monkey saddle and crossing waves — as a colour-graded 3D mesh you drag to rotate. Height colouring and the wireframe make critical points easy to spot: maxima, minima and the saddle points where the surface curves up one way and down the other.
Runs 100% in your browser — simulations are computed locally on your device.
Read the full guide to this tool
Notes
- A saddle point is a maximum along one direction and a minimum along another — the saddle z = x² − y² is the canonical example.
- The ripple sin(r)/r is the 2D analogue of the sinc function, with circular waves that decay like 1/r.
- Level curves are horizontal slices; they bunch together where the surface is steep.
- Runs 100% in your browser — simulations are computed locally on your device.
Related tools

3D Geometry Board
Points, lines, planes, spheres and polyhedra on an orbiting camera — slice solids with planes, unfold nets, drop the Dandelin spheres into a cone and drag everything.

Bézier Curve Playground
Drag control points and watch De Casteljau’s algorithm construct a Bézier curve step by step.

Central Limit Theorem Demo
Sample from any lopsided distribution and watch the averages pile up into a bell curve.

Conway’s Game of Life
Paint cells and watch Conway’s cellular automaton breed gliders, guns and oscillators.

Dynamic Geometry Board
Construct with points, lines, circles and transformations, then drag anything — the construction stays true, and a checker tells you which relations are theorems.

Fantasy Map Generator
Roll a seed and get a continent: coastlines, mountains, rivers, biomes and named towns, ready for your campaign.