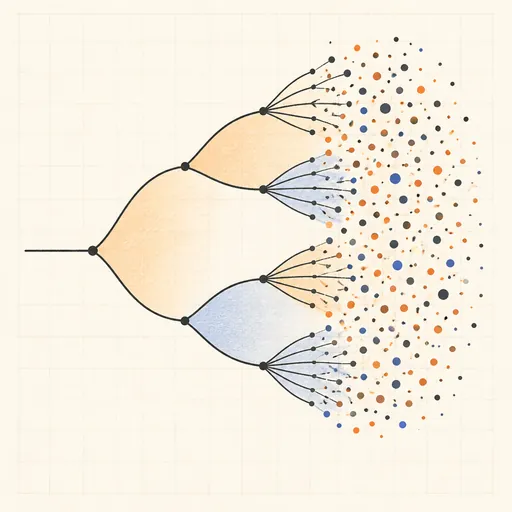
Logistic Map Bifurcation
The logistic map x → r x (1 − x) is a single line of arithmetic that becomes a textbook route into chaos. For each growth rate r, this tool iterates the map, throws away the transient and plots the values it settles on. At low r the population lands on one steady value; raise r and it splits to a two-cycle, then four, eight, sixteen, faster and faster, until it shatters into chaos speckled with sudden windows of order. The result is the famous bifurcation diagram. Zoom into any region to see it repeat itself, and click a value of r to watch that orbit play out as a time series.
Runs 100% in your browser — simulations are computed locally on your device.
Read the full guide to this tool
Notes
- The period-doubling cascade accelerates by a fixed factor: each split happens about 4.669 times sooner than the last, Feigenbaum’s constant, which turns up in many unrelated systems on their way to chaos.
- Chaos is riddled with periodic windows: near r = 3.83 a clean three-cycle appears out of the chaos, and by Sharkovskii’s theorem period three implies every other period exists too.
- The diagram is self-similar — zoom into a fork and a smaller copy of the whole cascade appears — linking this one-line map to fractals.
- Runs 100% in your browser — simulations are computed locally on your device.
Related tools
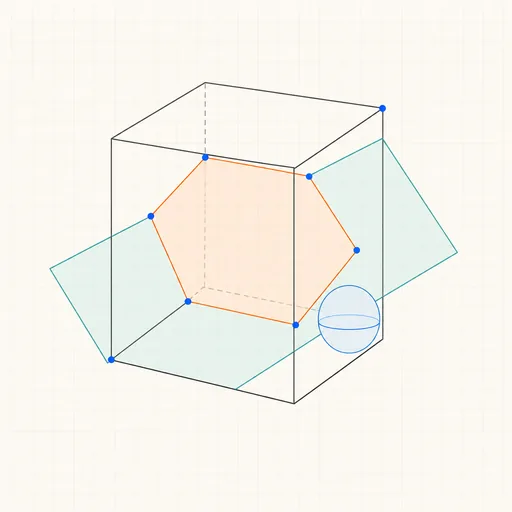
3D Geometry Board
Points, lines, planes, spheres and polyhedra on an orbiting camera — slice solids with planes, unfold nets, drop the Dandelin spheres into a cone and drag everything.
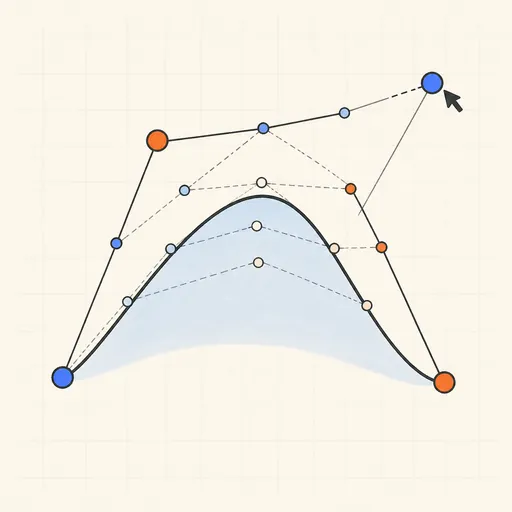
Bézier Curve Playground
Drag control points and watch De Casteljau’s algorithm construct a Bézier curve step by step.
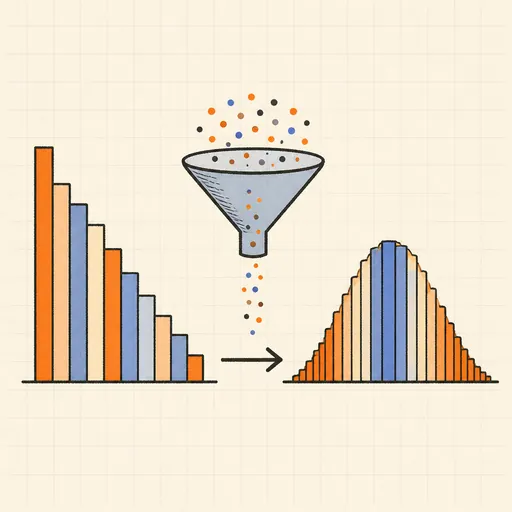
Central Limit Theorem Demo
Sample from any lopsided distribution and watch the averages pile up into a bell curve.
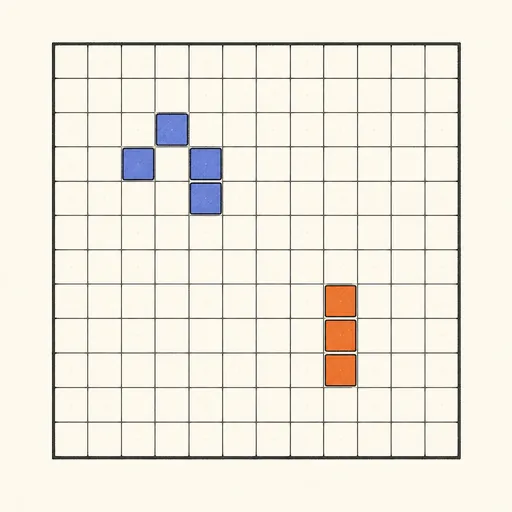
Conway’s Game of Life
Paint cells and watch Conway’s cellular automaton breed gliders, guns and oscillators.
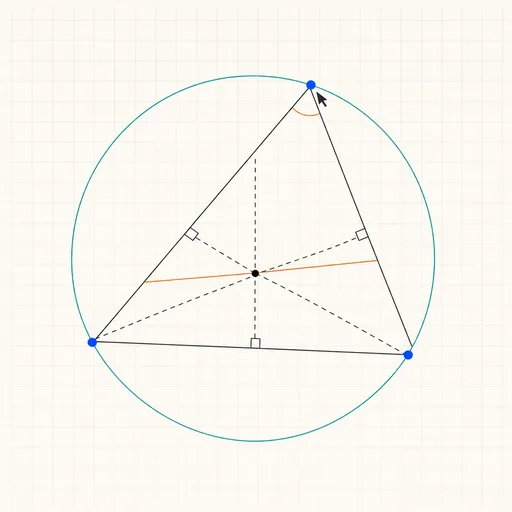
Dynamic Geometry Board
Construct with points, lines, circles and transformations, then drag anything — the construction stays true, and a checker tells you which relations are theorems.
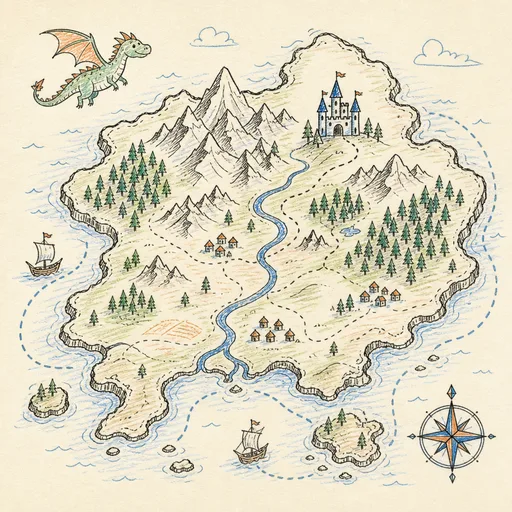
Fantasy Map Generator
Roll a seed and get a continent: coastlines, mountains, rivers, biomes and named towns, ready for your campaign.