
Waveform & Spectrogram Viewer
Renders an audio file as a zoomable waveform and a spectrogram (time vs frequency heat map), with peak, RMS and duration statistics. Useful for spotting clipping, silence, hum and bandwidth limits.
Runs 100% in your browser — your files never leave your device.
Read the full guide to this tool
Notes
- The spectrogram uses a short-time Fourier transform with a Hann window; brighter means more energy at that frequency and time.
- Everything runs locally in your browser; your files are never uploaded to any server.
Explore the idea
Related tools
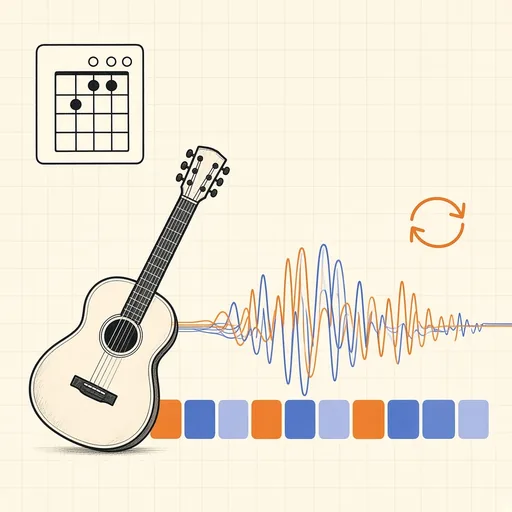
Song Practice Studio
Drop any song and get its chords, key and tempo in sync with the music, then loop, slow down and transpose it to practise along.
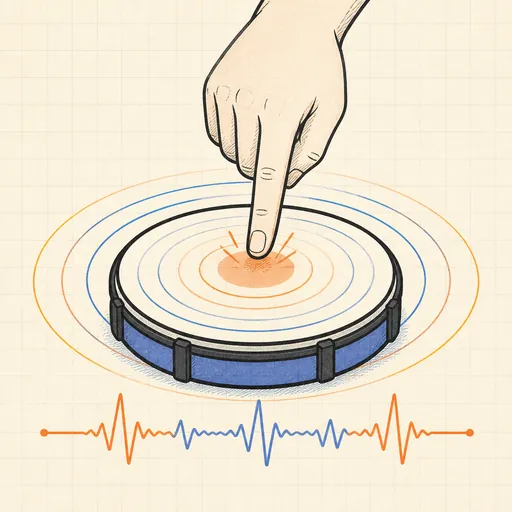
BPM Tapper & Detector
Tap a tempo or detect BPM from an audio file.

Audio Format Converter
Convert between WAV, MP3, OGG, FLAC, M4A and more.
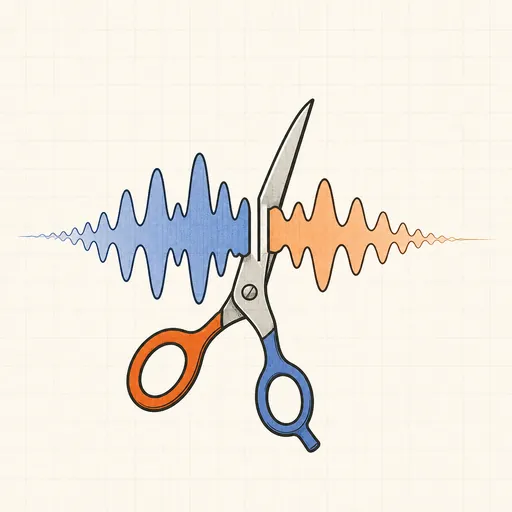
Audio Trimmer
Cut a section out of an audio file, with fades.

Chord Identifier
Name any chord from notes you pick or type.

Euclidean Rhythm Generator
Generate world-music rhythms from two numbers.