
Descriptive Statistics Calculator
Paste your data and get a full summary: central tendency, dispersion, distribution shape and outlier detection.
Read the full guide to this tool
Results
Notes
- Quartiles use linear interpolation (the default of most software).
- Outliers are flagged outside Q1 − 1.5·IQR and Q3 + 1.5·IQR.
Explore the idea
Related tools
Kaplan–Meier Survival Calculator
Survival curve, life table and median survival from time-to-event data with censoring.

Outlier Detector
Grubbs' test, Tukey fences and z-scores on your data.
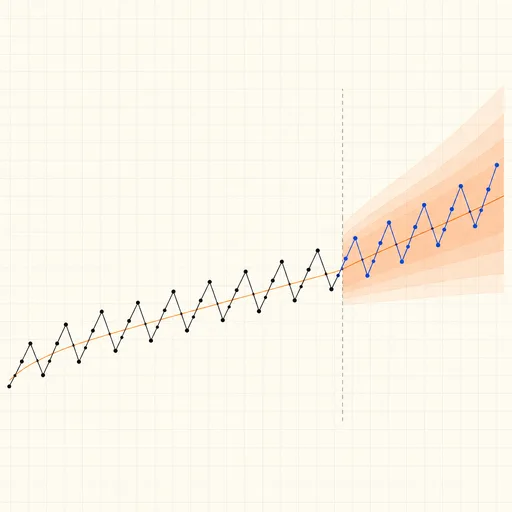
Time Series Lab: Decomposition, ETS & ARIMA Forecast
Paste a CSV: seasonal decomposition, ETS and ARIMA fits, forecast intervals and rolling-origin cross-validation.

Autocorrelation Calculator
ACF by lag with white-noise bands and the Ljung–Box test.

Covariance Calculator
Sample and population covariance with Pearson correlation.

Percentile Calculator
Find the value at a percentile, or the rank of a value.