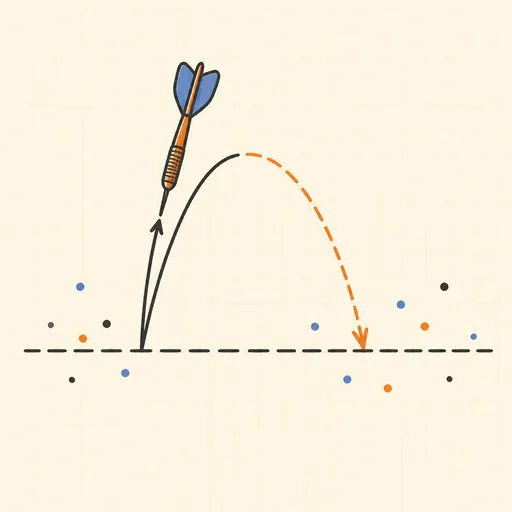
Regression to the Mean
Every performance is part skill, part luck — and luck does not carry over. This simulator gives each of N players a true skill drawn from a normal distribution and an observed score equal to skill plus fresh random luck, then plots season 1 against season 2. Highlight the top 10% of season 1 and watch their season-2 average fall back toward the population mean, while the bottom 10% climbs — nobody’s skill changed, only the luck was redrawn. Sliders for the skill spread and the luck spread recompute everything live, with a readout of the between-season correlation r = σ²_skill/(σ²_skill+σ²_luck) and the expected fall-back of the top group. Preset stories — the rookie of the year, star fund managers, and the flight instructors who concluded punishment beats praise — set the sliders and explain what regression to the mean does to each.
Runs 100% in your browser — simulations are computed locally on your device.
Read the full guide to this tool
Notes
- Selection on an extreme is selection on luck: the top group was picked partly for good luck, and since luck is redrawn next season, their expected score falls back — by exactly (1−r) of their distance from the mean.
- The between-season correlation equals the share of variance that is skill: r = σ²_skill / (σ²_skill + σ²_luck). All skill means no regression; all luck means complete regression.
- Kahneman’s flight instructors praised smooth landings and saw decline, punished bad ones and saw improvement — both were pure regression, and it taught them the false lesson that punishment works.
- The sophomore slump, “hot” fund managers who cool off, and the Sports Illustrated cover jinx are the same artefact: extreme performances are unrepresentative, and the follow-up is measured anyway.
- Runs 100% in your browser — simulations are computed locally on your device.
Related tools

3D Geometry Board
Points, lines, planes, spheres and polyhedra on an orbiting camera — slice solids with planes, unfold nets, drop the Dandelin spheres into a cone and drag everything.

Bézier Curve Playground
Drag control points and watch De Casteljau’s algorithm construct a Bézier curve step by step.

Central Limit Theorem Demo
Sample from any lopsided distribution and watch the averages pile up into a bell curve.

Conway’s Game of Life
Paint cells and watch Conway’s cellular automaton breed gliders, guns and oscillators.

Dynamic Geometry Board
Construct with points, lines, circles and transformations, then drag anything — the construction stays true, and a checker tells you which relations are theorems.

Fantasy Map Generator
Roll a seed and get a continent: coastlines, mountains, rivers, biomes and named towns, ready for your campaign.