A/B Test Peeking Simulator
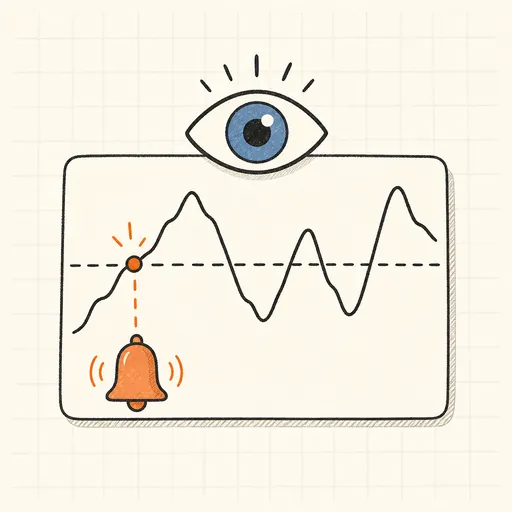
Both variants in this A/B test are identical — every “win” is a false positive by construction. That makes it the perfect instrument for measuring what peeking does to your error rate. Set the conversion rate, daily sample size and test length, then choose a strategy: a fixed-horizon test that looks once at the end at α = 5%; daily peeking that stops the moment p < 0.05; or an O’Brien–Fleming-style sequential boundary that spends its error budget across the looks. Watch a single experiment’s p-value wander across the 0.05 line day by day, then run a thousand experiments per strategy and compare the realised false-positive rates as bars: the fixed test holds 5%, naive peeking lands around 25–40%, and the sequential boundary restores honesty while still allowing early stops. Every peek is an honest two-proportion z-test — the inflation comes purely from taking many looks.
Runs 100% in your browser — simulations are computed locally on your device.
Read the full guide to this tool
Notes
- A 5% significance test gives a 5% false-positive chance per look. Peek daily for a month and you take ~30 draws from that lottery — the chance that some look crosses p < 0.05 climbs toward 30–40%, and stopping at the first hit locks the error in.
- Under the null the p-value is a random walk over accumulating data, and it is guaranteed to dip below any threshold eventually given enough looks — “sampling to a foregone conclusion.”
- Group-sequential boundaries fix peeking by demanding much stronger evidence at early looks (O’Brien–Fleming spends almost no α at the start), so the total error across all looks stays at 5%.
- The honest alternatives: fix the sample size in advance, use a sequential design with pre-set boundaries, or use always-valid inference — but never run a fixed-horizon test and stop it early on a good p-value.
- Runs 100% in your browser — simulations are computed locally on your device.
Related tools

3D Geometry Board
Points, lines, planes, spheres and polyhedra on an orbiting camera — slice solids with planes, unfold nets, drop the Dandelin spheres into a cone and drag everything.

Bézier Curve Playground
Drag control points and watch De Casteljau’s algorithm construct a Bézier curve step by step.

Central Limit Theorem Demo
Sample from any lopsided distribution and watch the averages pile up into a bell curve.

Conway’s Game of Life
Paint cells and watch Conway’s cellular automaton breed gliders, guns and oscillators.

Dynamic Geometry Board
Construct with points, lines, circles and transformations, then drag anything — the construction stays true, and a checker tells you which relations are theorems.

Fantasy Map Generator
Roll a seed and get a continent: coastlines, mountains, rivers, biomes and named towns, ready for your campaign.