Guess the Correlation
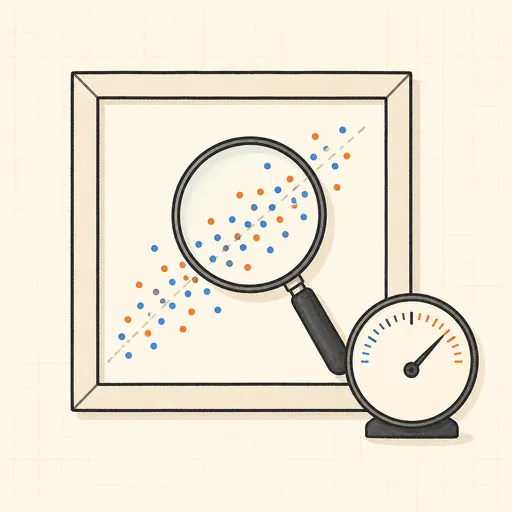
This is a game for calibrating your eye to correlation. A scatterplot is drawn from a hidden correlation coefficient r; you slide a guess from −1 to 1 and lock it in, then the true r and your error are revealed. A running score tracks your average error over the round so you can see yourself improving. It is a surprisingly hard skill — most people systematically underestimate how scattered a moderate correlation looks.
Runs 100% in your browser — simulations are computed locally on your device.
Read the full guide to this tool
Notes
- Pearson’s r runs from −1 (perfect negative) through 0 (no linear relation) to +1 (perfect positive).
- The cloud looks rounder than people expect: an r of 0.5 still shows a lot of scatter.
- r only measures the strength of a straight-line relation — a strong curved pattern can still have r near zero.
- Runs 100% in your browser — simulations are computed locally on your device.
Related tools

3D Geometry Board
Points, lines, planes, spheres and polyhedra on an orbiting camera — slice solids with planes, unfold nets, drop the Dandelin spheres into a cone and drag everything.

Bézier Curve Playground
Drag control points and watch De Casteljau’s algorithm construct a Bézier curve step by step.

Central Limit Theorem Demo
Sample from any lopsided distribution and watch the averages pile up into a bell curve.

Conway’s Game of Life
Paint cells and watch Conway’s cellular automaton breed gliders, guns and oscillators.

Dynamic Geometry Board
Construct with points, lines, circles and transformations, then drag anything — the construction stays true, and a checker tells you which relations are theorems.

Fantasy Map Generator
Roll a seed and get a continent: coastlines, mountains, rivers, biomes and named towns, ready for your campaign.