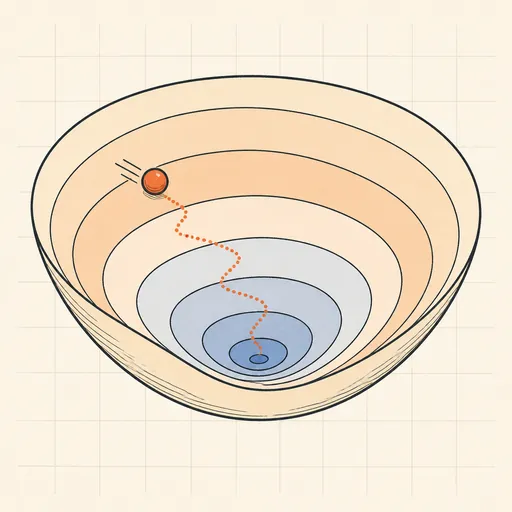
Gradient Descent Visualizer
Gradient descent minimises a function by stepping downhill along the negative gradient, and this visualizer races four variants — plain SGD, Momentum, RMSProp and Adam — from a common start point on a contour map. Choose the landscape: a convex bowl, an ill-conditioned ravine, the banana-shaped Rosenbrock valley, a saddle point or Himmelblau’s four-minima function. Click anywhere on the plot to move the shared start, drag the log-scale learning-rate slider, and toggle each optimizer on or off. Every optimizer leaves a coloured trail with a marker at its current position, its loss is reported live, and a warning appears when a too-large step size makes one diverge.
Runs 100% in your browser — models are trained and computed locally on your device.
Read the full guide to this tool
Notes
- Momentum accumulates a velocity v ← 0.9·v + ∇f and steps along it, damping the zigzag that plain gradient descent shows between the steep walls of a ravine.
- RMSProp and Adam divide each coordinate’s step by a running root-mean-square of its gradients, so ill-conditioned directions are rescaled automatically; Adam adds bias-corrected momentum on top.
- On a quadratic direction with curvature λ, plain gradient descent is only stable while the learning rate stays below 2/λ — push the slider up and watch the iterates overshoot and explode.
- A saddle point has zero gradient without being a minimum: on x² − y² a start exactly on the x-axis stalls, while any sideways offset eventually escapes downhill.
- Runs 100% in your browser — models are trained and computed locally on your device.
Related tools
Kalman Filter Visualizer
Track a moving target through noisy measurements with a full linear Kalman filter.
Simulated Annealing TSP
Watch simulated annealing untangle a travelling-salesman tour as the temperature falls.
Particle Swarm Optimization
Fly a swarm of particles across classic test functions and watch it converge on the minimum.
AI Learns to Drive (Neuroevolution)
Watch a population of neural-network cars evolve from crashing into corners to lapping a race track.
Backpropagation Step-by-Step
Walk through one forward and backward pass of a tiny neural network, number by number.
Decision Tree Builder
Grow a CART decision tree split by split and watch the partition map and tree diagram build together.