Reaction Time, Measured Honestly
After reading this you will know what the green-panel test actually measures, why the median adult sits near 250 ms, and how to read your five-try average without fooling yourself.
What the test measures
The Reaction Time Test times one thing: the gap between a visual signal appearing and your finger moving. The panel stays red for a random one-to-four-second wait, then flips to green. You click or press the spacebar. The stopwatch starts at the color change and stops at your input.
That gap is not one number. It is a chain. Light hits your retina, a signal travels the optic nerve, your visual cortex registers the change, a motor command travels down your arm, and the muscle contracts. Each link costs a few milliseconds. Add them up and a healthy adult lands around 250 ms for a simple visual choice with a single response.
Here is the hook. The random delay is not decoration. If the light always turned green after exactly two seconds, you would learn the rhythm and tap on a timer, not on the light. A reading of 90 ms would then mean you guessed well, not that your nervous system is fast. The random wait breaks that rhythm, so a low number has to come from genuine reaction.
When to use it, and when not
Use the test to compare yourself against yourself on one machine. It is good for tracking a warm-up effect, the cost of fatigue, or the difference between a rested morning and a tired evening. Run five tries, note the average, and repeat under the new condition.
Do not use it to rank yourself against a friend on a different screen, and do not read a medical meaning into it. A single slow run tells you almost nothing. The numbers below are population landmarks, not diagnoses.
Your hardware adds latency that has nothing to do with your brain. A 60 Hz monitor refreshes every 16.7 ms, so on average the green frame appears about 8 ms after the software decides to show it. A typical USB mouse adds several more. That is why a comparison across setups is unfair: 20 to 40 ms of the reading can be pure equipment.
The arithmetic of the score
A run is five valid tries. The score is the plain mean:
Here x_i is the time of the i-th valid try in milliseconds, n is the count of valid tries (five in a normal run), and \bar{x} is the average you see. The best single try is simply the smallest x_i.
The mean matters because a single click is noisy. Suppose your true reaction is drawn from a spread with a standard deviation of about 40 ms. The average of five independent tries has a standard deviation of 40 / \sqrt{5} \approx 17.9 ms. Averaging five tries more than halves the wobble compared with trusting one click.
To see spread within a run, use the sample standard deviation:
A small s (say under 20 ms) means you were consistent. A large s means one try dragged the rest, and you should look at the chart before trusting the average.
A worked example with the demo data
Five tries, one average
The demo run produces five valid times: 241, 268, 229, 255, and 247 milliseconds. Work the score by hand.
- Sum the five times:
241 + 268 + 229 + 255 + 247 = 1240ms. - Divide by
n = 5: \bar{x} = 1240 / 5 = 248 ms. That is your average. - The best single try is the smallest value,
229ms. - For spread, take each deviation from
248:-7,+20,-19,+7,-1. Square them:49,400,361,49,1. Sum is860. - Divide by n-1 = 4 to get
215, then take the square root: s = \sqrt{215} \approx 14.7 ms.
So the demo reports an average near 248 ms, a best of 229 ms, and a tight spread of about 15 ms. That average sits right on the median-adult landmark, and the small spread says all five tries agreed.
Reading your result against the landmarks
Once you have an average, place it against known ranges. These are visual reaction figures for a simple single-response task.
| Band | Average (ms) | What it usually means |
|---|---|---|
| Below 100 | < 100 | Anticipation, not reaction. Should be rejected. |
| Fast | 150 to 200 | Trained gamers and athletes trend here. |
| Typical adult | 200 to 270 | The median sits near 250. |
| Slower | 270 to 350 | Fatigue, distraction, or an unfamiliar setup. |
Note the hard floor. Nerve conduction and muscle activation alone cost more than 100 ms, so a genuine visual reaction under that figure is not physically plausible. The test throws out clicks that land during the red phase, and you should treat any sub-100 ms reading with suspicion even if it slips through.
Auditory reactions run faster, roughly 20 to 40 ms quicker, because the sound-to-brain pathway is shorter than the light-to-brain one. This test uses a visual signal, so compare it only with other visual tests.
The one thing to explore: how the mean absorbs a bad try
The reason the score uses five tries and not one is worth feeling rather than just reading. Drag a single try and watch what happens to the average and the best.
Common mistakes that inflate or ruin a run
Most bad readings come from a handful of habits.
- Anticipating the flip
- Clicking on a felt rhythm instead of the light. The random one-to-four-second delay exists to catch this, and an early click is discarded. If you find yourself getting many rejected tries, you are guessing.
- Mixing hardware
- Running the test on a fast gaming monitor one day and a laptop the next, then comparing. The
16.7ms refresh on a 60 Hz screen versus6.9ms on a 144 Hz screen alone can shift your average by5to10ms. - Trusting one try
- A single
190ms click feels great, but with a spread of40ms it is inside normal luck. The five-try average is the number to record. - Cold start
- Your first run of the day is usually your slowest. A few practice runs shave real time by waking up the motor pathway, so measure after a warm-up if you want your steady number.
Related tools on this site
If reflexes interest you, timing and perception tests nearby measure related channels. The Tempo & Rhythm Tapping Test measures timing jitter rather than latency, which is the flip side of the same motor system. The Typing Speed Test (WPM) turns quick reactions into sustained output and reports a consistency score. For perception thresholds, try the Color Discrimination Test, the Contrast Sensitivity Test, or the Hearing Frequency Test. To push working memory and mental speed, the N-Back Working Memory Test, the Mental Math Trainer, and the Doomsday Weekday Trainer drill the slower, deliberate side of cognition.
Frequently asked questions
What is a good reaction time?
For a visual single-response task, a five-try average of 200 to 270 ms is typical, with the median adult near 250 ms. Trained gamers and athletes often average 150 to 200 ms. Compare against your own past runs on the same device rather than against a target number.
Why was my click thrown out?
You clicked while the panel was still red, before the green signal appeared. That is anticipation, not reaction, so the try is discarded and does not count toward your five. The random delay is designed to make guessing unprofitable.
Can I really react in under 100 ms?
No. Nerve conduction plus muscle activation costs more than 100 ms on its own for a visual signal, so any lower reading is a lucky anticipation or a measurement glitch, not a genuine reaction.
Why does the score average five tries instead of taking my best?
A single click is noisy. If your tries scatter with a standard deviation of about 40 ms, the average of five has a standard deviation near 18 ms, so it is a far steadier measure of your true speed. The best is shown separately as a bonus, not as your score.
Does my monitor affect the result?
Yes. A 60 Hz screen adds about 8 ms on average from refresh timing, and your mouse or keyboard adds a few more, for a total of roughly 20 to 40 ms of hardware latency. That cost is constant on one setup, so comparing yourself to yourself on the same machine stays fair.
Related tools
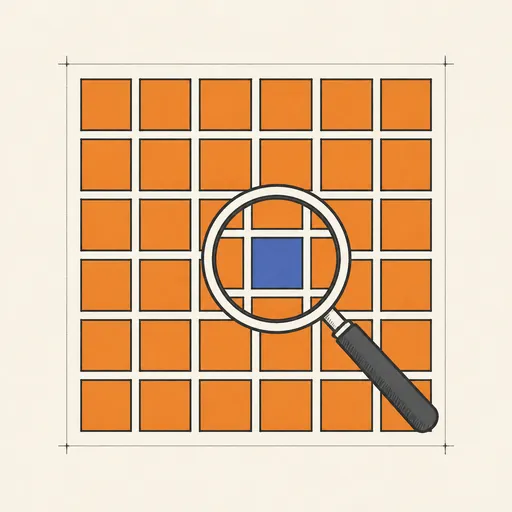
Color Discrimination Test
Spot the one tile with a slightly different color — the difference shrinks every time you get it right.
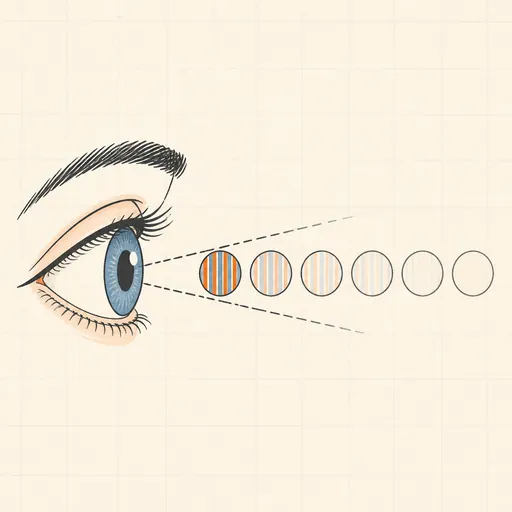
Contrast Sensitivity Test
How faint a pattern can you still see? A staircase test that estimates your contrast threshold.

Doomsday Weekday Trainer
Learn to name the weekday of any date in your head with the Doomsday algorithm — then drill it.
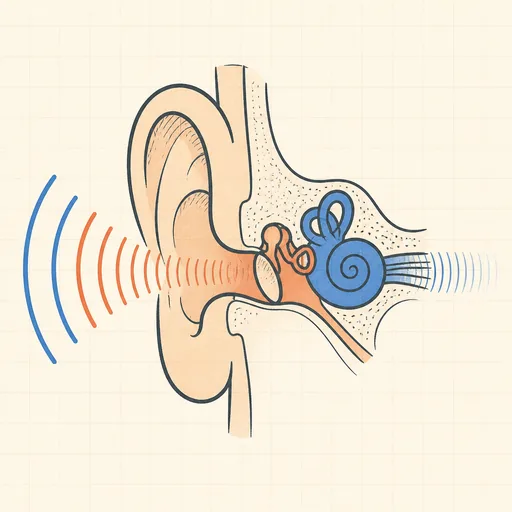
Hearing Frequency Test
Find the highest pitch you can hear and sketch your hearing profile across octave bands.

Mental Math Trainer
Timed arithmetic drills with streaks, accuracy and a per-operation breakdown — keyboard or keypad.
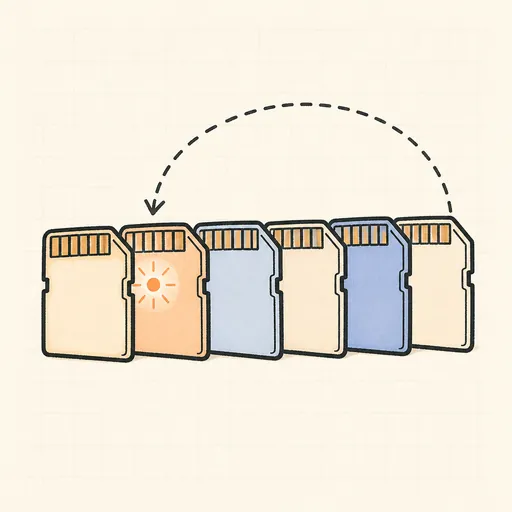
N-Back Working Memory Test
The dual N-back task from working-memory research: match positions and letters N steps back.