The Flashcard Workload Planner, Explained
After reading this you will know why a modest "20 new cards a day" habit turns into hundreds of daily reviews, how a single vacation multiplies your backlog, and how to read the three charts this planner draws.
What this planner does
You pick how many new cards you add each day, a retention target (say 90%), and a rating for how strong your memory is compared with an average learner. The planner then runs a year of studying on a memory model borrowed from SM-2 and FSRS. Every card carries a stability S, measured in days. Recall probability falls off as R = e^{-t/S} where t is days since the last review. The scheduler books each card for the day its predicted recall drops to your target.
Here is the hook. Suppose you add 20 cards a day and want 90% retention. In the first week you review almost nothing extra, because new cards are still fresh. By month three you are doing 150 to 250 reviews a day, most of them cards you first saw weeks ago that have now come due. The workload is not the new cards. It is the long tail of old cards cycling back.
Retention is an output, not a knob
This is the point people miss. You set a target retention, but the retention you actually observe depends on whether you review on time. If you always review a card on the exact day its recall hits 0.90, then across many cards you will observe about 90% correct. Skip the reviews and the cards keep decaying while nobody looks at them.
Schedule a 100-day break and the planner does not pause the forgetting curve. When you come back, cards that were due on day 40 have now had 100 days of decay. A card with stability S = 30 due at t = 30 (recall 0.368... wait, that is not the target). The scheduler had booked it for 90% recall, which is roughly t = 3.16 days for that stability. After 100 idle days its recall is e^{-100/30} = 0.036. It fails hard.
The forgetting curve and the stability formula
The decay half of the model is Ebbinghaus, formalized. A card's recall probability after t days is:
Here S is stability in days: the larger it is, the slower recall falls. When t = S, recall is e^{-1} \approx 0.368. To hit a target retention R_t, solve for the interval:
For R_t = 0.90, that is t \approx 0.105 \cdot S. So a card with S = 30 days schedules its next review in about 3.16 days at a 90% target, or about 6.9 days at an 80% target (-\ln(0.80) = 0.223). Lowering your target stretches every interval and cuts daily reviews.
The growth half is the spacing effect. Each successful, on-time review multiplies stability. A rough form used by these models is:
Here a and b are positive constants, and R is the recall at review time. The later you review (lower R), the bigger the multiplier, up to a point. Review too late and the card lapses: recall was near zero, you got it wrong, and stability restarts near its initial small value. The memory-strength rating scales both the starting stability and the growth factor relative to the p50 average learner.
A worked example with the demo data
20 new cards a day, 90% target, average memory
Use the demo defaults: 20 new cards per day, retention target 0.90, memory strength at p50. Track one representative card added on day 0 with initial stability S_0 = 1 day and growth multiplier 2.5 on an on-time review.
- First interval: t = -1 \cdot \ln(0.90) = 0.105 days, rounded up to 1 day. Review on day 1.
- On-time success multiplies stability: S = 1 \times 2.5 = 2.5 days. Next interval -2.5 \cdot \ln(0.90) = 0.263, rounded to about 1 day again early on, then growing.
- After a few reviews stability climbs:
2.5, then6.25, then15.6, then39days. Intervals become 1, 2, 4, then 10 days. - Each day you add 20 fresh cards, all needing a first review the next day, while older cards return on their longer schedules.
Now sum across the whole deck. Daily reviews equal 20 new cards plus every older card whose interval lands on today. Early on that is close to 20. By day 120 the accumulated old cards contribute another 120 to 220 reviews, so a "20 a day" plan costs 150 to 250 reviews a day at steady state.
Try the vacation slider
Reading the three charts
The tool draws three views. Read them together.
- Workload and backlog
- Daily reviews scheduled, plus the count of overdue cards. A rising backlog means you are falling behind; a flat backlog near zero means you are keeping up.
- Observed retention vs target
- The fraction of reviews answered correctly each day, plotted against your target line. When you review on time it hugs the target. After a break it plunges, then recovers as lapsed cards rebuild stability.
- Deck knowledge over time
- The fraction of the whole deck whose current recall is above some threshold. This is what you actually know, not what you reviewed today.
When to use it, and when not
Use the planner before you commit to a study rate. If you are about to load a 5,000-card medical deck and set 30 new cards a day, the planner shows the steady-state cost (often 250 to 400 reviews a day) before you feel it in month two. Use it also to test recovery plans: how many extra reviews per day clear a backlog by a deadline.
Do not read the projected numbers as a promise about your own memory. The model tracks expected fractions of cards, so the curves are smooth. Your real day has good and bad cards, interruptions, and cards that lapse repeatedly. Treat the planner's 180 reviews a day as a central estimate, not a guarantee.
Common mistakes
Three errors come up again and again.
- Chasing very high retention. Moving the target from 0.85 to 0.95 shortens every interval by the ratio \ln(0.95)/\ln(0.85) = 0.051/0.163 = 0.31. Intervals shrink to roughly a third, so daily reviews roughly triple. The extra 10 points of retention cost you a lot of time.
- Assuming new cards are the workload. New cards are a small slice. The mass is mature cards returning. Cutting new cards to zero for a week barely dents today's review count.
- Ignoring the backlog curve. A backlog that grows by 30 cards a day is invisible for a week and unmanageable in a month. Watch its slope, not its current value.
Related tools
To see the scheduling algorithms side by side, open the Spaced Repetition Simulator, which runs SM-2, FSRS and half-life regression on the same deck. For the decay curve alone, with clickable reviews that flatten each drop, use the Forgetting Curve Visualizer. If you care about how a tutoring system infers what you know from right and wrong answers, the Knowledge Tracing Simulator shows Bayesian Knowledge Tracing live.
Frequently asked questions
Why does 20 new cards a day become 180 reviews a day?
Each new card comes back many times over the year, at growing intervals. On any given day you see the 20 new ones plus every older card whose interval lands today. At steady state that sum is roughly 9 times the daily new-card count for a 90% target.
Does lowering my retention target really save that much time?
Yes. Intervals scale with -\ln(R_t). Going from 0.90 to 0.85 stretches intervals by \ln(0.85)/\ln(0.90) = 1.54, cutting daily reviews by about a third for a small drop in what you remember.
Why is my retention below target right after a break?
Overdue cards kept decaying while you were away. A card scheduled for 0.90 recall that sits idle for 100 days past due can fall below 0.05. Averaged with fresh cards, the first day back reads far under your target until lapsed cards rebuild.
Is the planner random or deterministic?
Deterministic. It tracks expected fractions of cards rather than simulating individual right and wrong draws, so the same inputs always produce the same smooth curves. Your real results will be noisier.
Does the memory-strength rating change my retention?
No. It changes your intervals. A stronger memory (higher percentile) gives larger initial stability and bigger growth per review, so cards return less often for the same target. Retention stays near the target if you review on time either way.
Related tools
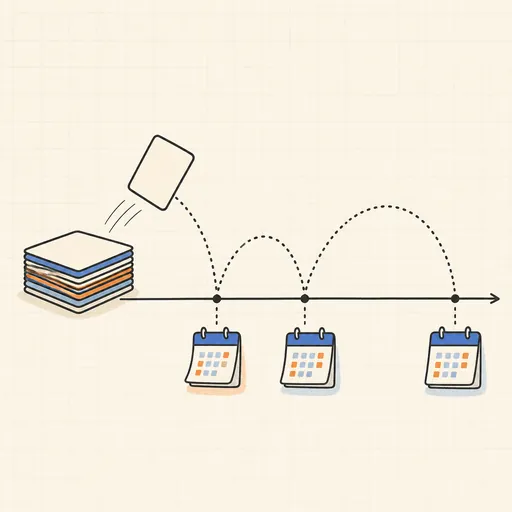
Spaced Repetition Simulator
SM-2, FSRS, HLR, Leitner and Pimsleur side by side — workload, retention and knowledge per study hour.
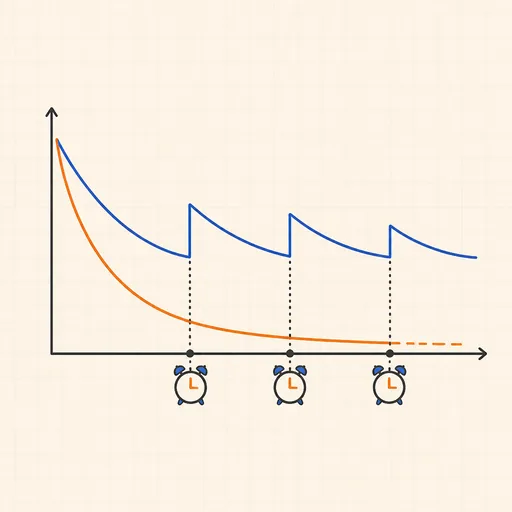
Forgetting Curve Visualizer
Ebbinghaus curve with a sweet-spot band — drag reviews early, on time, or late and watch the decay flatten.

Knowledge Tracing Simulator
Bayesian Knowledge Tracing live — each right / wrong answer shows the Bayes math in plain numbers.

Final Grade Calculator
What do you need on the final exam to reach your target grade? Instant answer for any weight.

GPA Calculator
Compute your GPA from course grades and credits — or ask what term GPA you need to hit a cumulative goal.

Math Worksheet Generator
Printable worksheets: arithmetic, fractions, algebra, order of ops, decimals, mixed numbers and percents.