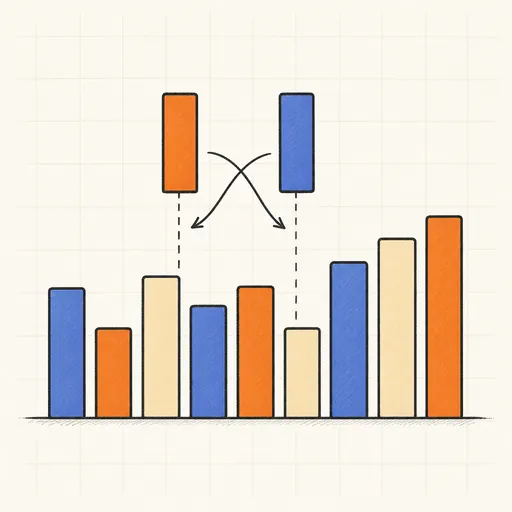
Sorting Algorithm Visualizer
Sorting algorithms are far easier to understand when you can watch them work. This visualizer animates the classic algorithms — bubble, selection, insertion, merge, quick, heap and shell sort — as they compare and swap coloured bars, highlighting the elements each one is currently touching. Choose an algorithm and array size, pick a starting arrangement (shuffled, nearly sorted, reversed or few-unique) and control the speed; a live counter tracks comparisons and swaps so you can compare the O(n²) sorts against the O(n log n) ones on the same data.
Runs 100% in your browser — simulations are computed locally on your device.
Read the full guide to this tool
Notes
- Bubble, selection and insertion sort run in O(n²) time; merge, quick and heap sort run in O(n log n) on average.
- The comparison and swap counters make the cost gap concrete — the quadratic sorts explode as the array grows.
- Starting arrangement matters: insertion sort is nearly linear on almost-sorted data, while naive quicksort degrades on already-sorted input.
- Runs 100% in your browser — simulations are computed locally on your device.
Related tools
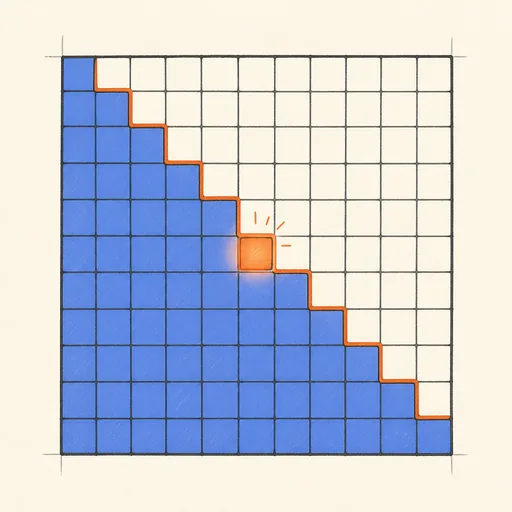
Dynamic Programming Visualizer
Watch edit distance and knapsack fill their tables cell by cell — dynamic programming with the lid off.
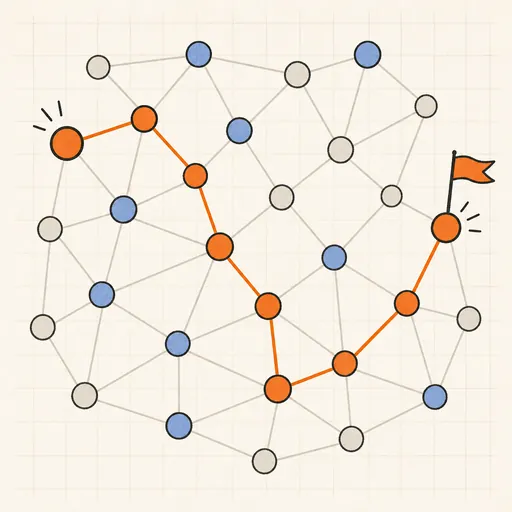
Graph Algorithm Playground
Build a graph by clicking, then watch BFS, DFS, Dijkstra and Prim explore it live.
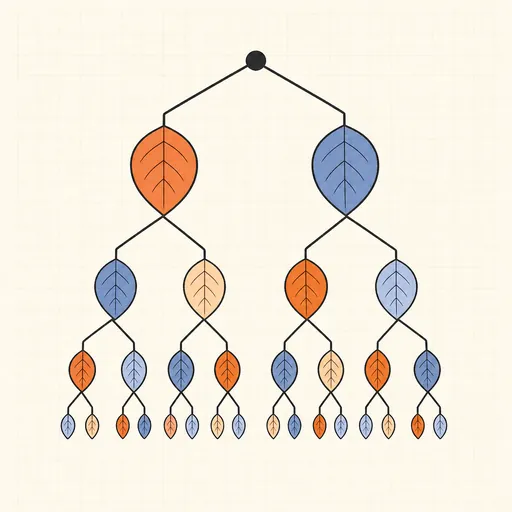
Huffman Coding Visualizer
Type any text and watch the optimal prefix code assemble itself as a tree, rare letters sinking deepest.
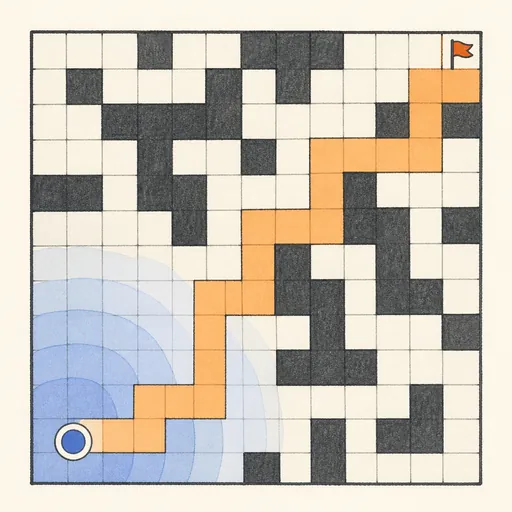
Pathfinding Visualizer
Draw walls and watch A*, Dijkstra, greedy and breadth-first search hunt for the shortest path.
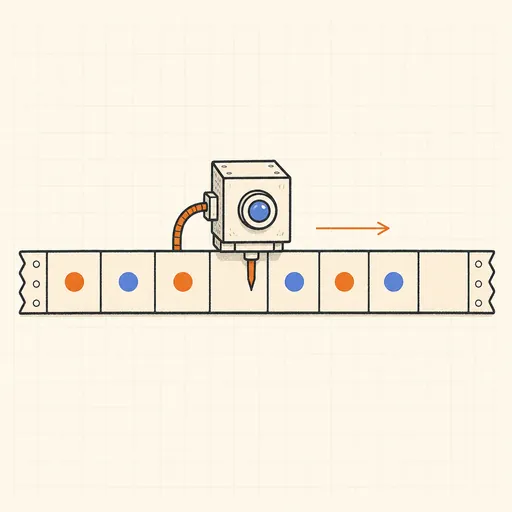
Turing Machine Simulator
Watch a Turing machine read, write and shuffle along its tape — computation stripped to its atoms.
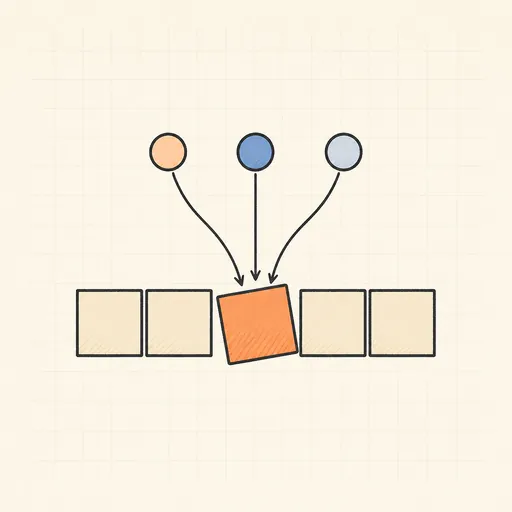
Hamming Code Playground
Flip any bit of a Hamming-encoded message and watch the parity checks point straight at the culprit.