How a GAN Trains, and Why It Collapses
After reading this you will understand the two-player game a GAN plays, be able to write down and check its loss functions by hand, and recognize mode collapse the moment it shows up in the 2D trainer.
What a GAN actually is
A generative adversarial network pairs two neural networks and makes them compete. The generator G takes random noise and outputs fake data points. The discriminator D looks at a point and outputs a number between 0 and 1: its estimate that the point came from the real dataset rather than from G.
The two are trained in opposite directions. D tries to score real points near 1 and fake points near 0. G tries to make its fakes score near 1, that is, to fool D. Neither has a fixed target. Each one's job depends on how good the other currently is.
In the 2D trainer the real data is a set of blue points arranged as a ring of 8 Gaussians, a spiral, or two moons. The generator maps 2D Gaussian noise through two hidden layers of 16 units to orange points. Run it on the ring and you will often see the orange cloud pile onto two or three of the eight blue blobs, ignore the rest, then hop to different blobs a few seconds later. That hopping is mode collapse, and it is the single most instructive failure a GAN shows.
When to reach for a GAN, and when not to
GANs learn to sample from a distribution. They do not give you a density value for a point, and they do not maximize a clean likelihood. If your goal is to draw new examples that look like your data, a GAN fits. If your goal is to score how likely a given point is, a GAN is the wrong tool.
The adversarial setup is worth the trouble when the data lives on a complicated, thin region of a high-dimensional space and you cannot write down its density. The cost is training instability. Because both networks move at once, the loss does not fall toward zero the way it does in ordinary supervised training. It oscillates, and you have to read other signals to know whether things are going well.
The 2D trainer is a teaching model. Two hidden layers of 16 units on 2D data tell you nothing quantitative about training a face generator with hundreds of millions of parameters. What transfers is the shape of the dynamics: the balance between the players, the collapse onto a few modes, and the oscillating losses.
The loss functions, symbol by symbol
Write x for a real data point and z for a noise vector. The discriminator is trained to maximize its ability to tell the two apart:
Here D(x) is the discriminator's score for a real point, and D(G(z)) is its score for a fake point. The first term pushes D(x) toward 1 (so \log D(x) toward 0). The second term pushes D(G(z)) toward 0. The \mathbb{E} symbols are averages over a batch.
The generator's original objective was to minimize that same second term, which is the minimax form \log(1 - D(G(z))). In practice that gradient vanishes exactly when the generator is losing, which is when it needs a signal most. The 2D trainer uses the non-saturating loss instead:
This asks G to make D(G(z)) large. Check the gradient behavior with numbers. Suppose D is winning and scores a fake at D(G(z)) = 0.1. The minimax loss \log(1 - 0.1) = \log(0.9) = -0.105 is nearly flat there, so its slope is tiny. The non-saturating loss -\log(0.1) = 2.303 is large and steep. The generator keeps learning.
A worked step you can check
Work one discriminator update by hand on a two-point batch, using the ring setup that the demo button loads. Take one real point that D currently scores at D(x) = 0.6 and one fake point scored at D(G(z)) = 0.4.
One discriminator loss evaluation
- Real term: \log D(x) = \log(0.6) = -0.5108.
- Fake term: \log(1 - D(G(z))) = \log(0.6) = -0.5108.
- The discriminator objective for this batch is the average of the two, (-0.5108 - 0.5108)/2 = -0.5108. Training moves D to make this less negative, that is, closer to 0.
- The generator loss on the same fake is -\log D(G(z)) = -\log(0.4) = 0.9163. Training moves G to lower this, which means pushing D(G(z)) up from 0.4 toward 1.
Now imagine one perfect step: D raises the real score to 0.7 and lowers the fake score to 0.3. Recompute the discriminator objective: (\log 0.7 + \log 0.7)/2 = (-0.3567 - 0.3567)/2 = -0.3567. It rose from -0.5108 to -0.3567. The discriminator improved. But that same step made the generator loss worse: -\log(0.3) = 1.204, up from 0.9163. That is the competition in one line of arithmetic.
The equilibrium, and why the curves oscillate
The game has a well-known balance point. When G reproduces the real distribution exactly, no discriminator can do better than guessing, so the best possible D outputs 0.5 everywhere. At that point both accuracies sit near 50%, and both loss curves hover rather than fall.
Plug D = 0.5 into the losses. The discriminator objective per point is (\log 0.5 + \log 0.5)/2 = -0.6931. The generator loss is -\log 0.5 = 0.6931. Watch for both curves settling into a band around those values. That is the sign of a healthy GAN, not a curve diving to zero.
How to read the trainer while it runs
Watch four things at once. The orange points show where G currently sends a fixed bank of noise. The faint heatmap behind them shows D's decision surface: dark where D says fake, light where it says real. The two loss curves show the tug of war. The status line reports how cleanly D separates real from fake.
On the ring of 8, healthy progress looks like orange points spreading toward several blue blobs while the heatmap stays roughly flat and gray. Mode collapse looks like orange points clustered on one or two blobs while the heatmap carves sharp dark valleys around the abandoned blobs. When you see the orange cluster jump from one blob to another, you are watching G chase whichever mode D just started punishing.
Common mistakes
The mistakes below all come from the same root: the balance between the two players.
- Overtraining the discriminator
- Set k high or the discriminator learning rate large and D becomes near perfect. It scores fakes at, say, 0.02. The generator gradient scales with D(G(z))(1 - D(G(z))) = 0.02 \times 0.98 = 0.0196, almost zero. The generator stalls.
- Undertraining the discriminator
- If D is barely trained it scores everything near 0.5 for the wrong reason. Its gradient points nowhere useful, so G chases a meaningless target and wanders.
- Expecting the loss to converge
- Treating a rising generator loss as failure. In a balanced GAN, G's loss going up often means D just improved, which is normal. Judge sample quality and mode coverage, not the loss alone.
- Reading mode collapse as slow learning
- A tight, confident orange cluster is not progress if it covers one blob out of eight. Coverage matters more than the sharpness of any single cluster.
The loss never rewards covering all modes at once. If G puts every fake on one blob and fools D there, its loss is low even though seven blobs are empty. This is why the ring of 8 is the standard collapse test: the metric that would punish collapse is not part of the objective.
Related tools on this site
A GAN is one way to learn to sample from a distribution. For a different mechanism that avoids the adversarial game entirely, try the Diffusion Model Toy, which learns to reverse a noising process step by step and tends to cover modes more evenly. For a non-neural generative model where you can see every transition probability by hand, see the Markov Chain Text Generator.
Frequently asked questions
Why does my GAN loss not go to zero?
Because two networks move against each other, there is no shared quantity to minimize. At the ideal balance the discriminator loss sits near 0.693 per point and the generator loss near 0.693 as well, and both oscillate. A loss diving to zero usually means one player has crushed the other, which is failure, not success.
What is mode collapse in plain terms?
The generator learns to produce only a few kinds of output that reliably fool the current discriminator, ignoring the rest of the data. On the ring of 8 Gaussians you see orange points on two or three blobs while five or six stay empty. The objective never charges the generator for missing modes.
What does the k slider do?
It sets how many discriminator updates run per generator update. Higher k keeps D sharp but drives fake scores toward 0, where the generator gradient D(G(z))(1-D(G(z))) is tiny. Lower k gives a weaker but more informative D. There is no single best value; it depends on the data and learning rates.
Why the non-saturating generator loss?
The original minimax loss \log(1 - D(G(z))) is nearly flat when D(G(z)) is small, so a losing generator gets almost no gradient. The non-saturating form -\log D(G(z)) is steep there, so the generator keeps learning even while D is winning.
Do these 2D results predict large-scale GAN behavior?
Only qualitatively. The dynamics you observe (oscillating losses, collapse, sensitivity to balance) appear at scale too, but the numbers here come from a model with two 16-unit layers on 2D points. Nothing about training time, image quality, or parameter counts carries over.
Related tools
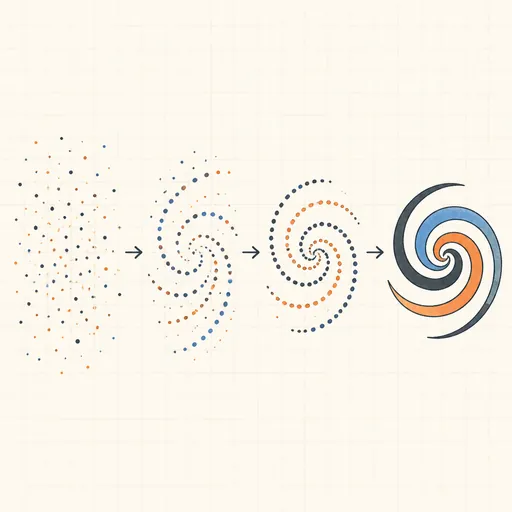
Diffusion Model Toy
Train a tiny denoising diffusion model and watch it turn pure noise back into a 2D shape.
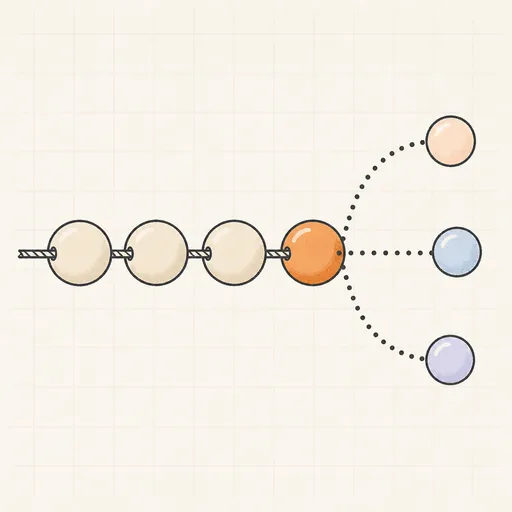
Markov Chain Text Generator
Train an order-k Markov chain on any text and generate new text one token at a time.
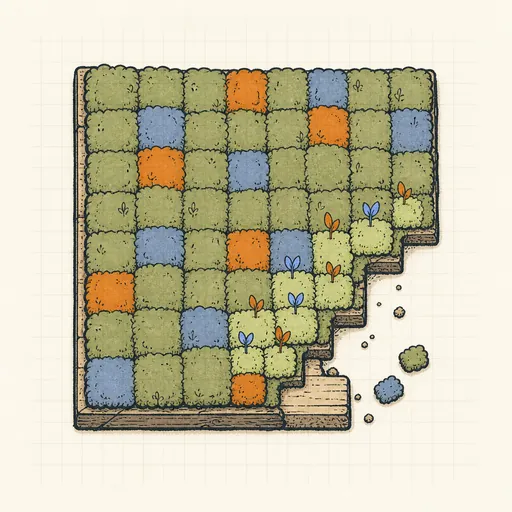
Neural Cellular Automata Sandbox
Grow, damage and heal living textures driven by a tiny convolutional network in every cell.
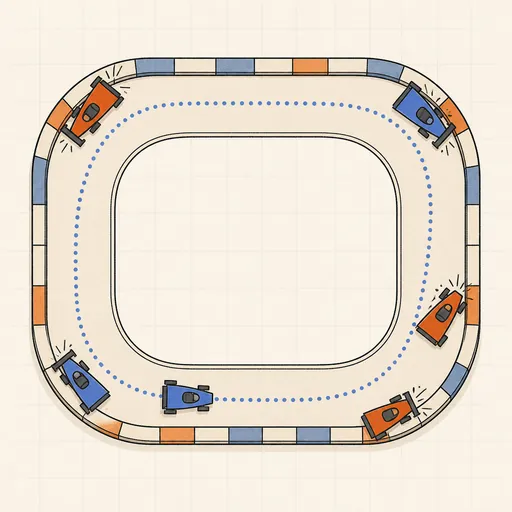
AI Learns to Drive (Neuroevolution)
Watch a population of neural-network cars evolve from crashing into corners to lapping a race track.
Backpropagation Step-by-Step
Walk through one forward and backward pass of a tiny neural network, number by number.
Decision Tree Builder
Grow a CART decision tree split by split and watch the partition map and tree diagram build together.