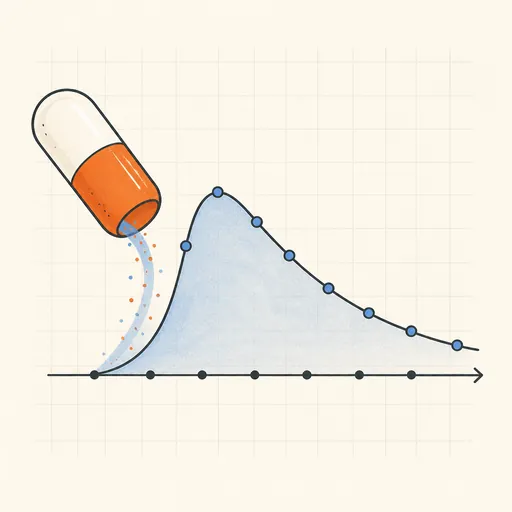
Drug Half-Life & Dosing Simulator
See the curve behind every dosing schedule. Pick a common substance — caffeine, ibuprofen, paracetamol, melatonin and more — or enter any half-life and absorption time, set the dose, how often you take it and for how many days, and the simulator draws the blood-concentration curve hour by hour using the standard one-compartment model with first-order absorption. Watch each dose stack on the last until the curve levels off at steady state, see how long the substance genuinely takes to wash out after the final dose, and compare two regimens side by side — 200 mg every 4 hours versus 400 mg every 8 — to see why the pattern matters as much as the total. Markers show peak and trough levels, time to steady state and the accumulation ratio.
Runs 100% in your browser — simulations are computed locally on your device.
Read the full guide to this tool
Notes
- The model: absorption pulls the dose into blood at rate ka while elimination clears it at rate ke = ln 2 / half-life — the tug-of-war produces the classic rise-peak-decay shape of each dose.
- Repeated dosing reaches steady state after roughly 4–5 half-lives, when each new dose only replaces what was eliminated; the accumulation ratio tells you how much higher steady-state levels sit above the first dose.
- "Out of your system" takes longer than intuition says: after the last dose, 5 half-lives still leave ~3% circulating — for caffeine (5 h half-life) that’s a full day.
- Real pharmacokinetics vary by person, age, liver and kidney function, interactions and genetics; curves here are population-typical illustrations.
- Runs 100% in your browser — simulations are computed locally on your device.
- This is an educational estimate, not medical advice; consult a professional for decisions about your health.
Related tools
Antibiotic Resistance Evolution Simulator
Watch bacteria evolve resistance — and see why finishing the course matters.
Blood Alcohol Estimator
Widmark BAC estimate and hours until sober.
Herd Immunity Threshold Explorer
See how vaccinating enough people stops an outbreak for everyone.
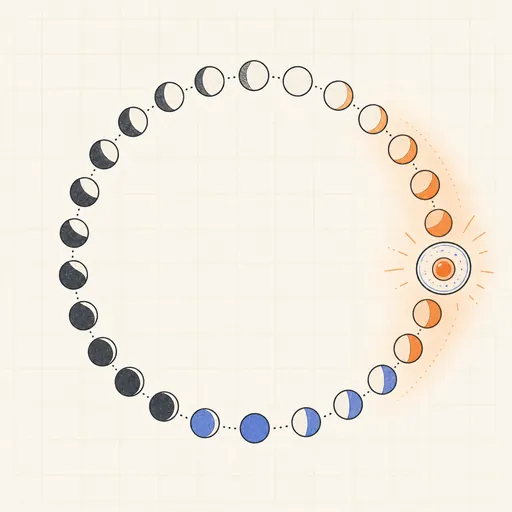
Ovulation & Fertility Calculator
Fertile window and ovulation for the next six cycles.

Pregnancy Due Date Calculator
Due date from last period, conception or IVF transfer.
Water Intake Calculator
Daily fluid target from weight, exercise and climate.