Planetarium & Star Chart
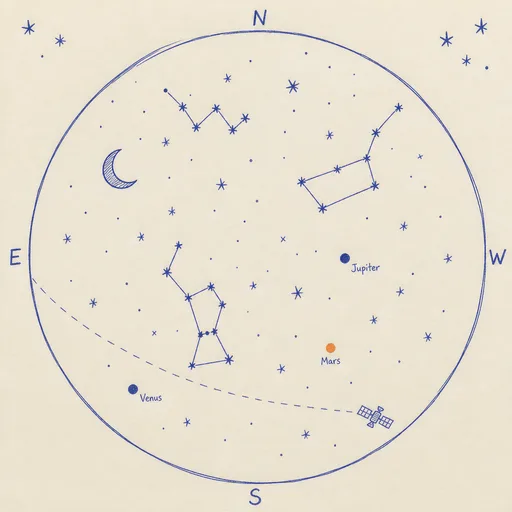
A live planetarium drawn in your browser. Pick a place and a moment — or let it follow the clock — and see the dome of the sky as you would from the ground: 5,000 stars to sixth magnitude with constellation lines, the Sun, Moon and all seven planets, an alt-az grid and the ecliptic. Planets come from the VSOP87 planetary theory and the Moon from the ELP-2000/82 lunar theory, star positions are corrected for precession, nutation, aberration and refraction, and satellites such as the ISS are propagated from two-line elements with SGP4 — complete with a table of upcoming passes and whether each one is sunlit and visible. Play time forward to watch the sky turn, hover over anything for its coordinates, and download the chart as an image.
Runs 100% in your browser — your files never leave your device.
Read the full guide to this tool
Notes
- The chart is a stereographic projection of the sky centred on the zenith: the outer ring is the horizon, north is up and east is on the left, the way a chart looks when you hold it overhead. Switch to map view to put east on the right.
- Planet and Moon positions agree with JPL ephemerides to a few arc-seconds over the 20th–22nd centuries — about a thousand times finer than the plot can show. Satellite positions are only as good as the elements: fetch fresh ones from CelesTrak for passes tonight.
- Times are read and shown in your browser’s clock, not the observer’s local time zone; the UTC instant is always printed under the chart. Deep-space satellites (periods over 225 minutes, such as GPS or geostationary) are not modelled.
- Star data: Hipparcos/Yale bright stars via the d3-celestial dataset (BSD licence).
- Runs 100% in your browser — your files and data never leave your device.
Explore the idea
Related tools
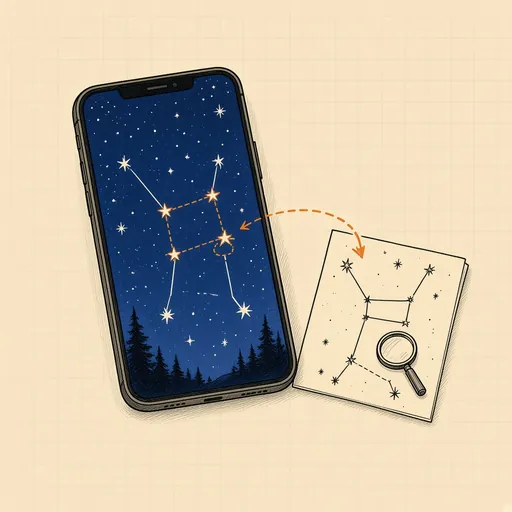
Star Photo Identifier
Drop a photo of the night sky and every star, constellation and nebula in it is found and named, along with where the camera was pointing.
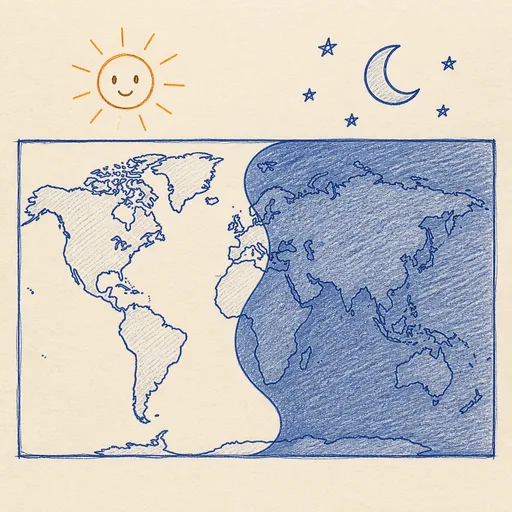
Day & Night World Map
Live sunlight terminator on a world map, with date and time sliders.
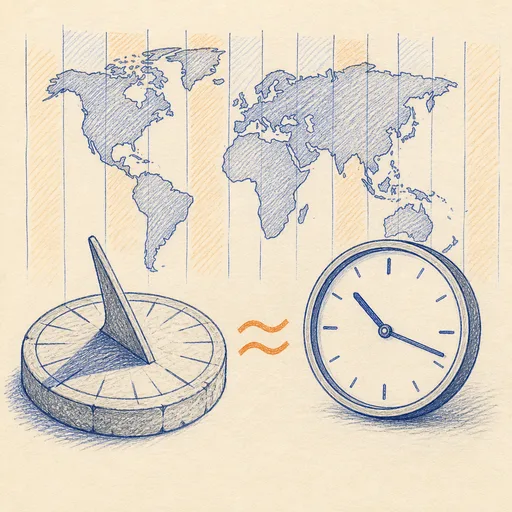
Solar Time vs Clock Time
How wrong is your clock? See the gap between official time and sun time anywhere on Earth.
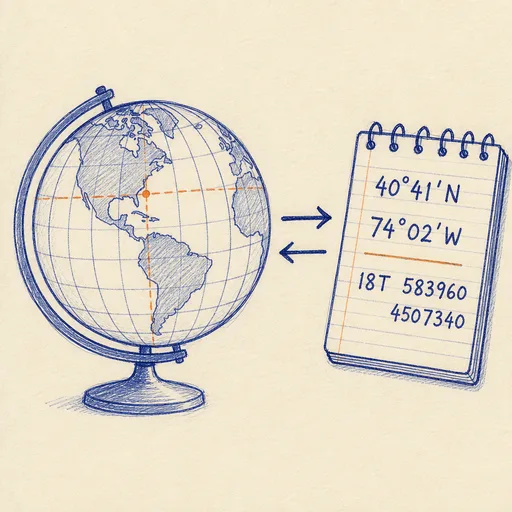
Coordinate Converter
Convert between decimal degrees, DMS, UTM, MGRS, geohash and Plus Codes — with a map.
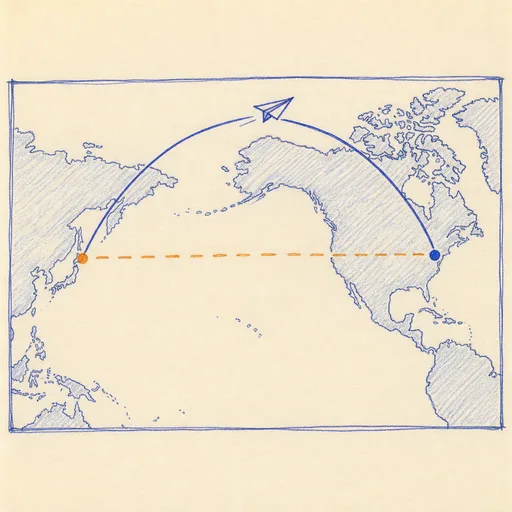
Great Circle vs Rhumb Line
Why flights look curved on the map: shortest path vs constant bearing between any two points.
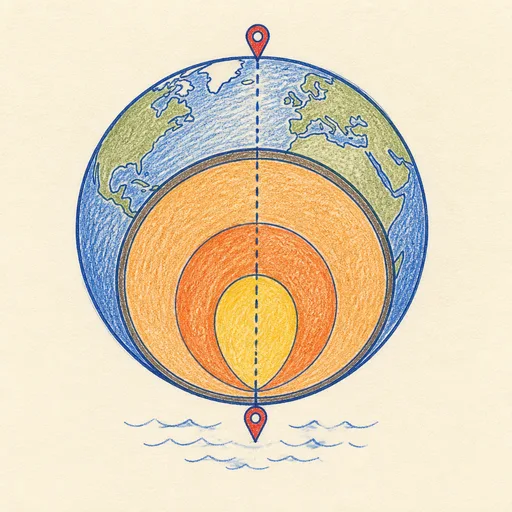
Antipode Finder
Click any point on Earth and see where you would come out if you dug straight through.