CAGR, Explained
After reading this you can turn any two-point growth story (a starting value, an ending value, and the years between them) into one steady annual percentage, and you will know when that number tells the truth and when it hides the real ride.
What CAGR is
The compound annual growth rate answers a single question: if your money had grown by the same percentage every year, what percentage would take you from where you started to where you ended? It is a smoothing device. Real investments jump around. CAGR replaces that jagged path with the one smooth exponential curve that hits the same two endpoints.
Here is the hook. Suppose an investment doubled from 10000 to 20000 over 5 years. You might be tempted to say it grew "100% over 5 years, so 20% per year." That is wrong, because growth compounds. The correct answer is about 14.87% per year. The gap between 20% and 14.87% is the whole reason this calculator exists.
When to use it and when not to
Use CAGR when you have exactly two values separated by a known span of time and you want a single yearly rate to compare against something else: another fund, an index, a savings rate, or inflation. It is the standard way fund fact sheets state multi-year performance, so it is the right tool for apples-to-apples comparison.
Do not use CAGR when the money moved in and out during the period. If you added contributions or took withdrawals, the two-endpoint picture is misleading, and you want a cash-flow method instead. For that, reach for the IRR Calculator or the NPV Calculator. If you are projecting future growth with regular monthly deposits, use the Investment Growth Calculator.
CAGR uses only the first and last values. Everything in between is invisible to it. A fund that soared then crashed back can post the same CAGR as one that crept up quietly. Never read CAGR as a measure of risk or steadiness.
The formula and why it looks like that
Start from how compounding works. If a value grows at a fixed rate r for n years, each year multiplies the previous total by (1 + r). After n years:
Here V_{\text{end}} is the ending value, V_{\text{begin}} is the beginning value, r is the annual growth rate written as a decimal, and n is the number of years. You know the two values and the years, and you want r. Divide both sides by the beginning value, take the n-th root, and subtract 1:
The ratio V_{\text{end}} / V_{\text{begin}} is the total growth multiple over the whole period. Raising it to the power 1/n spreads that multiple evenly across the years. Subtracting 1 converts the multiplier back into a growth rate. That last step matters: a multiplier of 1.1487 means the value is 114.87% of the previous year, which is a growth rate of 14.87%.
A worked example
Doubling 10,000 in 5 years
These are the calculator's default values: begin 10000, end 20000, years 5.
- Form the growth multiple:
20000 / 10000 = 2. The money doubled. - Take the 5th root: 2^{1/5} = 2^{0.2} \approx 1.148698.
- Subtract 1:
1.148698 - 1 = 0.148698. - Express as a percentage: r \approx 14.87\% per year.
Check it by compounding forward. Start with 10000 and multiply by 1.148698 five times: 11487.0, 13195.1, 15157.2, 17411.0, 20000.0. You land exactly on 20,000, which confirms the rate.
Reading and interpreting the result
A CAGR is a per-year figure, so compare it only against other per-year figures. If your fund shows 14.87% and a broad index returned 9% over the same years, the fund grew faster. If a savings account paid 4%, the fund grew much faster, but recall the warning: CAGR says nothing about how bumpy the ride was.
Watch the sign and size carefully. A CAGR can be negative when the ending value is below the beginning value. If 10000 falls to 8000 over 3 years, the multiple is 0.8, the cube root is about 0.9283, and the CAGR is about -7.17% per year. A negative CAGR is a real, valid answer, not an error.
The rate is also sensitive to the number of years. The same doubling over different spans gives very different annual rates, because the growth gets spread over more or fewer compounding periods.
| Years | Growth multiple | CAGR |
|---|---|---|
| 1 | 2 | 100.0% |
| 3 | 2 | 25.99% |
| 5 | 2 | 14.87% |
| 10 | 2 | 7.177% |
| 20 | 2 | 3.526% |
Common mistakes
The most frequent error is dividing total return by the number of years. Total return here is 100% over 5 years, and 100% / 5 = 20%, which overstates the true 14.87%. Simple division ignores compounding, so it always exceeds the real CAGR for positive growth.
A second mistake is mixing nominal growth with inflation. A 14.87% CAGR in a year of high inflation buys less than the number suggests. To convert to purchasing power, use the Inflation-Adjusted Return Calculator, which applies the Fisher equation.
A third is forgetting fees. A headline CAGR that ignores annual fund costs overstates what you actually keep. The Investment Fee Impact Calculator shows how a fee of even 1% per year compounds into a large drag over decades. And if your return came partly from dividends, CAGR on price alone understates it; see the Dividend Yield Calculator and the Dividend Reinvestment (DRIP) Calculator.
Fractional years are fine. If a position ran from January to the following July, that is 1.5 years. The formula handles any positive number of years, so enter the real span rather than rounding to whole years.
How CAGR relates to other return measures
CAGR is a special case of the annualized return of the simpler ROI Calculator: annualized ROI and CAGR use the same root-and-subtract formula. The difference is only in framing. ROI often reports the total gain first, then annualizes it, while CAGR reports the annual figure directly.
For single-asset trades where fees matter, the Crypto Profit Calculator, the Stock Average Price Calculator, and the Position Size Calculator handle cost basis and sizing, which sit upstream of any growth-rate calculation.
Frequently asked questions
Is CAGR the same as average annual return?
No. Average annual return is the plain mean of yearly returns. CAGR is the geometric equivalent that accounts for compounding. If a value rose 50% then fell 50%, the simple average is 0%, but the value is now 0.75 of the start, so the CAGR over two years is about -13.4%. The geometric figure is the honest one.
Can CAGR be negative?
Yes. Whenever the ending value is below the beginning value, the growth multiple is less than 1 and the CAGR is negative. Falling from 10,000 to 8,000 over 3 years gives about -7.17% per year.
Why does dividing by years give the wrong answer?
Because growth compounds on itself. Each year's gain earns further gains in later years, so the yearly rate needed is smaller than a straight division suggests. For the doubling example, straight division gives 20% but the true CAGR is 14.87%.
What years value should I use for a partial year?
Use the exact fraction. Eight months is 0.6667 years, and eighteen months is 1.5 years. The formula works for any positive real number, so precision here improves the rate.
Does CAGR tell me how risky an investment was?
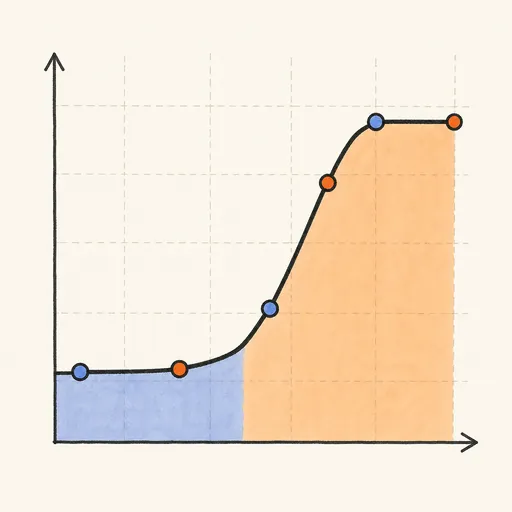
No. It uses only the two endpoints and ignores every value in between. Two investments with identical CAGRs can have wildly different volatility, as the chart above shows.
This is an educational estimate, not financial advice. Talk to a qualified adviser before making money decisions.
Related tools
Dollar-Cost Averaging Calculator
Project a regular investing plan’s future value.

Investment Growth Calculator
Portfolio projection with monthly contributions.
Options Strategy Lab
Build multi-leg option strategies and see the payoff curve, Greeks and probability of profit update live.
ROI Calculator
Return on investment, simple and annualized.
Capital Gains Tax Calculator
Profit and tax on a sold investment.

Dividend Yield Calculator
Yield, annual income and yield on cost.