Options Strategy Lab
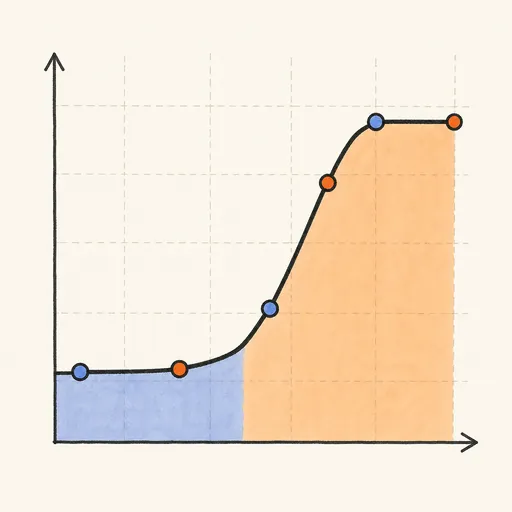
An interactive laboratory for stock options. Assemble a strategy from up to six legs — long or short calls, puts and stock — or load a preset (covered call, straddle, strangle, iron condor, butterfly, vertical spreads) and the lab draws the expiry payoff together with the theoretical P/L curve today, priced leg-by-leg with Black-Scholes. Drag the sliders for days to expiry, implied volatility and interest rate and watch the curve bend: theta decay pulls the mark toward the expiry kinks, volatility fattens or flattens it. The panel reports breakevens, max profit, max loss and net position Greeks (delta, gamma, theta, vega), and a Monte Carlo run of terminal prices estimates the probability of profit and the P/L distribution.
Runs 100% in your browser — simulations are computed locally on your device.
Read the full guide to this tool
Notes
- Legs are priced with the Black-Scholes-Merton formula on a non-dividend underlying; the "today" curve is the sum of leg values minus your net premium at entry.
- Greeks are per-share and summed across legs with sign: delta is exposure to price, theta the value bleed per day, vega the sensitivity to a 1-point change in implied volatility.
- Probability of profit comes from simulating thousands of lognormal terminal prices at the chosen volatility — a market-implied estimate, not a forecast of the actual distribution.
- American-style early exercise, dividends, bid-ask spreads and assignment risk are not modelled.
- Runs 100% in your browser — simulations are computed locally on your device.
- This is an educational estimate, not financial advice; talk to a qualified adviser before making money decisions.
Related tools

CAGR Calculator
Compound annual growth rate between two values.

Dollar-Cost Averaging Calculator
Project a regular investing plan’s future value.

Investment Growth Calculator
Portfolio projection with monthly contributions.
ROI Calculator
Return on investment, simple and annualized.

Capital Gains Tax Calculator
Profit and tax on a sold investment.

Dividend Yield Calculator
Yield, annual income and yield on cost.