Wi-Fi Coverage Planner, Explained
After reading this you will be able to predict, in dBm, how much signal reaches a room across two brick walls, understand why 5 GHz dies where 2.4 GHz survives, and decide where to put a router or mesh node before you drill any holes.
What the planner does and why signal drops so fast
The planner treats radio like light in a foggy room. A router sits at one point. From there, signal spreads outward and gets weaker with distance. Every wall the signal crosses steals a fixed chunk of power. The tool draws a heatmap so you can see, at a glance, which corners get a usable signal and which do not.
Here is the hook. Put a router in your living room. At 5 GHz you get roughly 400 Mbps in the same room. Walk into the bedroom past one drywall wall and one brick wall and the signal has dropped by about 24 dB from the wall losses alone, before distance is even counted. That is a factor of 250 in power. The bedroom that felt "one room away" is electromagnetically far.
Radio power is measured in dBm, decibels relative to one milliwatt. The scale is logarithmic: every 10 dB is a factor of ten in power, every 3 dB is a factor of two. A router at 20 dBm transmits 100 mW. Your phone hears something like -60 dBm, which is 0.000001 mW. The whole game is watching that tiny number sink toward the noise floor.
When to use it and when not to
Use the planner to compare placements. Should the router go in the hallway or the corner bedroom? Does a mesh node in the kitchen fix the far end of the apartment? Those are relative questions, and the model answers them well because the same simplifications apply everywhere on the map.
Do not use it as a survey. The model traces one straight line from router to point and adds up wall losses. Real radio bounces off floors, ceilings and metal, leaks through doorways, and interferes with itself. A real signal often reaches a "dead" corner by reflecting around the wall the ray says it must pass through.
The map shows a lower bound in spirit, not in fact. Reflections usually help, so a room the planner paints red may actually work. But a concrete wall with a steel mesh, or a large mirror, can be far worse than the average the tool uses. Treat colors as a ranking, not a promise.
The formula, one piece at a time
Two effects set the received power: spreading loss with distance, and lump losses at walls. Start with free space.
Here L_{fs} is the free-space path loss in dB, d is distance in kilometres, and f is frequency in MHz. The constant 32.45 folds in the units and the speed of light. The key fact hiding in the two 20\log_{10} terms: double the distance and you lose 6 dB, double the frequency and you also lose 6 dB. That second term is why 5 GHz starts life about 6.6 dB behind 2.4 GHz at the same distance.
Now add the walls. Each wall on the straight ray subtracts its own attenuation:
P_{rx} is received power in dBm, P_{tx} is the transmit power (EIRP) in dBm, and A_i is the attenuation of wall i that the ray crosses. The tool uses 20 dBm EIRP by default, the 2.4 GHz regulatory limit in much of the world.
Wall losses at 2.4 GHz, roughly double at 5 GHz:
| Material | 2.4 GHz (dB) | 5 GHz (dB) |
|---|---|---|
| Glass | 2 | 4 |
| Drywall | 3 | 6 |
| Brick | 8 | 16 |
| Concrete | 12 | 24 |
A worked example you can reproduce
Load the demo (it uses the field defaults): one router at 20 dBm, the default floor plan, and both bands available. Pick a point 8 metres from the router at 2.4 GHz (2437 MHz) with two walls on the ray, one drywall and one brick.
Signal into a room two walls away
- Convert distance to kilometres:
8 m = 0.008 km. - Distance term: 20\log_{10}(0.008) = -41.94 dB.
- Frequency term: 20\log_{10}(2437) = 67.73 dB.
- Free-space loss: -41.94 + 67.73 + 32.45 = 58.24 dB.
- Wall losses: drywall
3plus brick8equals11dB. - Received power: 20 - 58.24 - 11 = -49.2 dBm.
That is above the -55 dBm "excellent" line, so this room streams and calls comfortably. Now switch the same point to 5 GHz (5240 MHz). The frequency term rises to 20\log_{10}(5240) = 74.39 dB, and the walls now cost 6 + 16 = 22 dB. Received power becomes 20 - 64.90 - 22 = -66.9 dBm, right at the edge of reliable. The identical point drops by 17.7 dB just by changing band.
How signal falls with distance
The chart below traces received power against distance for both bands, with no walls, so you see the pure spreading effect. The 2.4 GHz curve sits about 6.6 dB above the 5 GHz curve everywhere, and both fall by 6 dB per doubling of distance.
Walls change the picture more than distance does. Moving from 4 m to 20 m in open air costs 14 dB. Adding one concrete wall costs 12 dB at 2.4 GHz and 24 dB at 5 GHz. In a real building, walls dominate.
Reading and interpreting the heatmap
The color bands follow common site-survey practice. Match what you see to what you can actually do:
- Above -55 dBm (excellent)
- Full throughput, hundreds of Mbps at 5 GHz. Put your desk here.
- -55 to -67 dBm (good)
- Reliable for streaming, video calls and normal browsing. -67 dBm is the usual working floor.
- -67 to -75 dBm (marginal)
- Connects, but the rate drops and calls may stutter under load.
- Below -75 dBm (poor)
- Expect dropouts and slow reconnects. A device may still show bars and still fail.
The status line scores the fraction of floor area above the good threshold. Use that single number to compare two router positions. If moving the router from the corner to the hallway raises coverage from 62 percent to 88 percent, that is your answer.
When one router cannot cover the floor, drop a second one and watch where the two heatmaps overlap. Aim the handoff zone (where both are near -67 dBm) at a doorway, not in the middle of a room, so devices roam cleanly.
Common mistakes
Reading the map as absolute truth. No multipath, no furniture, no floors above or below. The model is a comparison engine. If it says a room is 10 dB better with the router moved, trust the direction, not the exact dBm.
Forgetting the return path. The map shows router-to-device power. Your phone transmits at lower power than the router, so the uplink is often the weaker link. A spot that shows -70 dBm downstream may struggle more than the color suggests.
Assuming 5 GHz is always better. It is faster where it reaches, but the worked example showed it losing 17.7 dB at the same two-wall point. In a brick building, 2.4 GHz often wins on coverage even though it looks slower in the same room.
Ignoring EIRP limits. Cranking the transmit power in the tool is not free in reality. The default 20 dBm is a legal ceiling in many regions, and a higher number on the map may not be reachable with legal hardware.
Related tools
If the router placement question turns into an antenna question, the Antenna Radiation Pattern Explorer shows why more elements narrow the beam and where a directional antenna points its energy. For acoustics in the same rooms, the Room Modes & Speaker Placement tool solves the analogous problem for bass. And if you end up wiring a small circuit for a repeater or sensor, the Ohm's Law Calculator covers the basics.
Frequently asked questions
Why does 5 GHz drop so much faster through walls?
Two reasons stack. Free-space loss is about 6.6 dB higher at 5 GHz for the same distance, and wall attenuation is roughly double. In the worked example the same two-wall point dropped from -49.2 dBm at 2.4 GHz to -66.9 dBm at 5 GHz, a 17.7 dB difference.
What received power do I actually need?
Aim for -67 dBm or stronger everywhere you use the network. Above -55 dBm you get top rates. Below -75 dBm expect dropouts. Devices lie about "bars," so trust the dBm value.
Can I model a two-story house?
Not directly. The planner is a single flat floor. A concrete or wood-and-joist ceiling typically costs 12 to 20 dB, so approximate an upstairs room by adding a wall of that loss to your mental estimate, then verify in place.
Why is my real signal better than the red zone predicts?
The model ignores reflections. Signal reaches many "blocked" spots by bouncing off floors, ceilings and metal instead of punching straight through the wall. The red map is often pessimistic in a normal furnished room.
Does more transmit power fix a dead corner?
Rarely, and it is usually illegal past 20 dBm EIRP. Adding 6 dB of power gains one extra brick wall at 2.4 GHz. A mesh node placed past the walls beats brute-force power every time.
Related tools
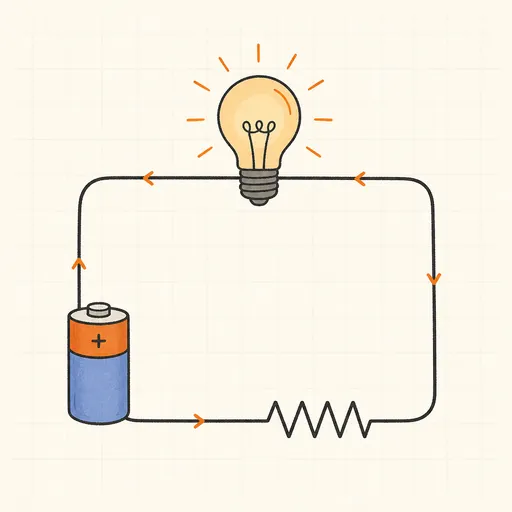
Ohm's Law Calculator
Any two of V, I, R, P — get all four.
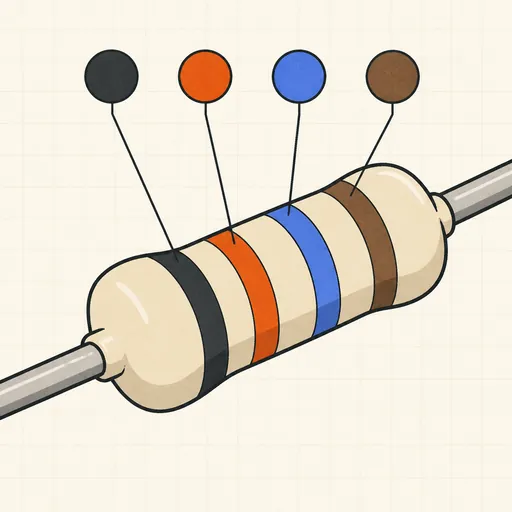
Resistor Color Code Calculator
4- and 5-band colors → value, or value → colors.
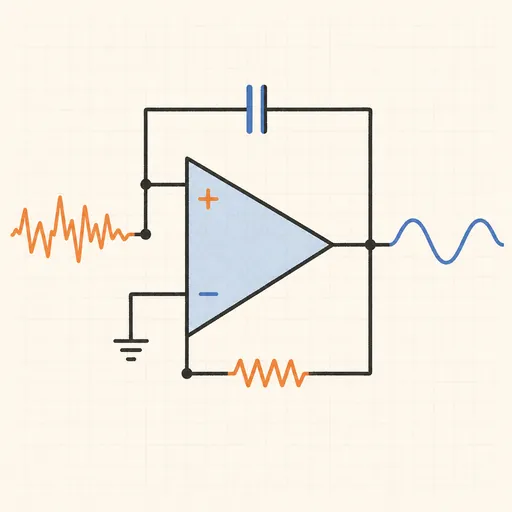
Active Filter Designer (Sallen-Key)
Butterworth, Chebyshev or Bessel — component values and Bode plot.
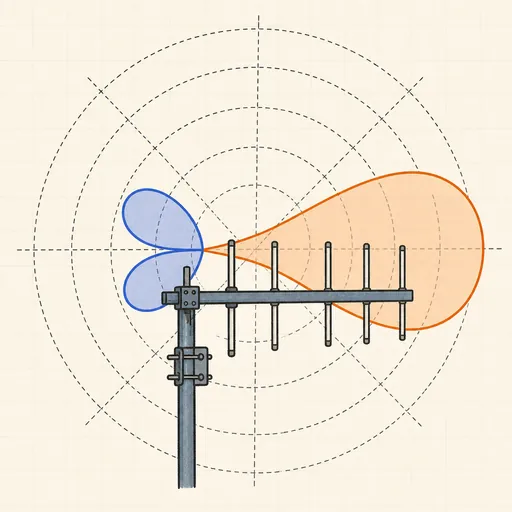
Antenna Radiation Pattern Explorer
Polar plots of dipoles, Yagis and phased pairs — see why more elements mean a narrower beam.
Capacitor Charge Calculator
RC time constant, charge curve and stored energy.

E-Series Resistor Solver
Best E12–E96 resistor or pair for any value or ratio.