One-Proportion Z-Test, Explained
After reading this you can test whether an observed proportion, like 60 successes out of 100, differs from a hypothesised value such as 0.5, using both the normal approximation and the exact binomial p-value.
What this test does
You have a single yes/no outcome measured on a sample: heads or tails, converted or not, defective or fine. You count x successes out of n trials. The observed proportion is \hat{p} = x/n. The one-proportion z-test asks a narrow question: is \hat{p} far enough from a fixed number p_0 that chance alone is an unconvincing explanation?
Suppose a coin lands heads 60 times in 100 flips. The observed rate is 0.60. A fair coin has p_0 = 0.5. Is 0.60 surprising for a fair coin? The test turns that gap into a number you can judge. As you will see below, 60 out of 100 gives a two-sided p-value near 0.046, just under the usual 0.05 line.
When to use it, and when not
Use this test when you have one sample, one binary outcome, and a specific value p_0 to compare against. That value comes from theory (a fair coin gives 0.5), a standard (a process should stay under a 2% defect rate), or a historical baseline.
Do not use it in these situations:
- You are comparing two observed proportions, such as conversion in group A versus group B. Use the A/B Test Significance Calculator instead.
- Your outcome has more than two categories, or you are testing an association between two variables. See the Chi-Square Test of Independence or Chi-Square Goodness-of-Fit Test.
- Your data are paired before/after measurements on the same subjects. Use McNemar's Test.
The trials must be independent and share the same success probability. If you flip a coin 100 times, fine. If you survey 100 people but pick whole households, responses within a household are correlated, and the test will report a p-value that is too small.
The formula and the intuition
Under the null hypothesis H_0: p = p_0, the count of successes follows a binomial distribution with mean n p_0 and standard deviation \sqrt{n p_0 (1 - p_0)}. Dividing by n gives the sampling distribution of \hat{p}. Its standard error under the null is:
Here p_0 is the hypothesised proportion and n is the sample size. The z-statistic counts how many standard errors separate the observed proportion from the hypothesised one:
The key detail: the standard error uses p_0, not \hat{p}. Because you are testing a specific hypothesis, you assume it is true when you measure spread. When the null is true, z follows an approximately standard normal distribution, so a value beyond \pm 1.96 corresponds to a two-sided p-value below 0.05.
The exact binomial p-value skips the normal approximation entirely. It adds up the probabilities of every outcome as extreme as, or more extreme than, the one you observed, using the binomial distribution directly. For small n that exact value is what you should trust.
Worked example: 60 successes in 100 trials
Reproducing the demo
The demo uses x = 60, n = 100, and p_0 = 0.5.
- Observed proportion: \hat{p} = 60/100 = 0.60.
- Standard error under the null: SE_0 = \sqrt{0.5 \times 0.5 / 100} = \sqrt{0.0025} = 0.05.
- z-statistic: z = (0.60 - 0.50)/0.05 = 2.0.
- Two-sided p-value from the normal approximation: 2 \times P(Z \gt 2.0) \approx 2 \times 0.02275 = 0.0455.
- Exact binomial two-sided p-value: sum the probabilities of getting 60 or more, and 40 or fewer, heads out of 100 when p = 0.5. That comes to about
0.0569.
Notice the two methods disagree slightly: 0.0455 versus 0.0569. The normal approximation calls the result significant at 0.05; the exact test does not. When they straddle your threshold like this, report the exact value and treat the finding as borderline.
Explore how the count changes the verdict
Reading the output
The calculator returns \hat{p}, the z-statistic, the normal-approximation p-value, and the exact binomial p-value. Read them in that order.
- z-statistic
- Signed distance from p_0 in standard errors. A positive z means \hat{p} \gt p_0; negative means below. Magnitude beyond 1.96 corresponds to two-sided significance at 0.05.
- Normal p-value
- The chance, if the null is true, of a z at least this far from zero. Fast, and accurate when both n p_0 and n(1-p_0) exceed about 10.
- Exact p-value
- The same probability computed directly from the binomial distribution, with no approximation. Preferred whenever counts are small or p_0 is near 0 or 1.
A small p-value means the observed proportion is hard to reconcile with p_0. It does not tell you the size of the effect. With n = 100, 60 successes gives a 10 point gap from 0.5; with n = 10000, 5100 successes gives only a 1 point gap yet a much smaller p-value. Always look at \hat{p} - p_0 alongside the p-value. To convert a z-statistic you got elsewhere into a p-value, use the P-value Calculator.
Common mistakes
The errors below quietly change the answer.
- Using \hat{p} in the standard error. The null-based SE uses p_0. Plugging in
0.60instead of0.50gives \sqrt{0.6 \times 0.4/100} = 0.049 and z = 2.04, a subtly wrong figure. That estimate belongs to a confidence interval, not this test. - Trusting the normal approximation on tiny samples. With
x = 3,n = 10, p_0 = 0.5, the expected count n p_0 = 5 is below the guideline of 10. Report the exact binomial p-value here. - Confusing one-sided and two-sided. A one-sided test at 0.05 uses a cutoff of 1.645, not 1.96. Decide the direction before you see the data, not after.
- Reading significance as importance. A defect rate of 2.1% against a target of 2.0% can be significant with a large enough
nand still not matter to your process.
Related tools
If your question involves more than one proportion or a different data shape, these fit better:
- Fisher's Exact Test for a 2×2 table with small counts.
- t-Test Calculator when the outcome is a mean, not a proportion.
- One-Way ANOVA Calculator to compare means across three or more groups.
- Mann-Whitney U Test, Wilcoxon Signed-Rank Test, and Kruskal-Wallis H Test for ranked or nonnormal data.
- Levene's Test for Equal Variances and the Normality Test Battery for checking assumptions before a parametric test.
Frequently asked questions
Why does the exact p-value differ from the z-test p-value?
The z-test smooths the discrete binomial counts into a continuous normal curve. That smoothing introduces small errors, largest when n is small or p_0 is near 0 or 1. For 60 of 100 the two land at 0.0455 and 0.0569. When they disagree, report the exact value.
How large does n need to be for the normal approximation?
A common rule is that both n p_0 and n(1-p_0) should be at least 10. With p_0 = 0.5 that means n \ge 20. With p_0 = 0.02 you need n \ge 500 before the approximation is comfortable.
Should I use a one-sided or two-sided test?
Use two-sided unless you have a directional hypothesis fixed in advance, such as "the defect rate has risen above 2%." A two-sided test at 0.05 needs |z| \gt 1.96; a one-sided test needs z \gt 1.645 in the stated direction.
Can I test a proportion of exactly 0 or 1?
Yes. If x = 0 out of n = 30 against p_0 = 0.10, the normal SE still works but the tail is skewed, so lean on the exact binomial p-value, which here is about 0.042.
Does this give me a confidence interval too?
The test answers a yes/no question about p_0. A confidence interval for \hat{p} uses the observed proportion in its standard error, not p_0, so it is computed separately even though the two are related.
Related tools

Chi-Square Test of Independence
Test association between two categorical variables from a contingency table.

One-Way ANOVA Calculator
Compare the means of three or more groups with an F-test.
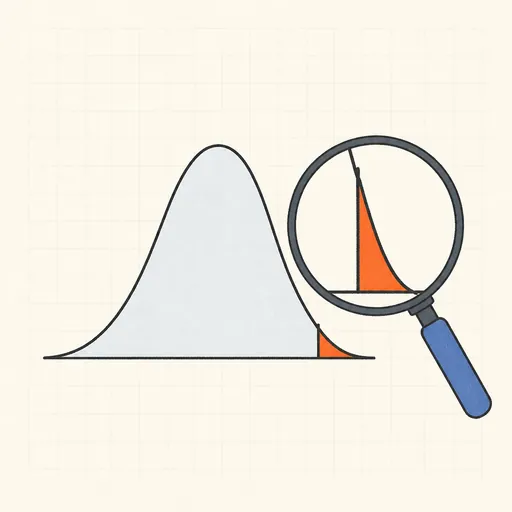
P-value Calculator
Convert z, t, χ² or F statistics into p-values.
t-Test Calculator
One-sample, two-sample (pooled/Welch) and paired t-tests from raw data.
A/B Test Significance Calculator
Two-proportion z-test with p-values, uplift and CI of the difference.

Chi-Square Goodness-of-Fit Test
Test whether observed counts match an expected distribution.