The Normality Test Battery, Explained
After reading this you will know what Shapiro–Wilk, D'Agostino and Kolmogorov–Smirnov actually measure, how to read three verdicts at once without fooling yourself, and when a histogram tells you more than any p-value.
What a normality test does
Many common procedures assume your data come from a normal distribution. A one-sample t-test, a confidence interval built from the standard error, and the residuals of a linear model all lean on that assumption to some degree. A normality test asks a single question: could a sample that looks like this plausibly have come from a normal population?
The null hypothesis is "the data are normal." A small p-value is evidence against normality. A large p-value means you failed to find evidence against it, which is not the same as proving the data are normal.
Consider twelve fill weights in grams: 4.8, 5.1, 5.3, 4.9, 5.0, 5.2, 4.7, 5.4, 5.0, 4.9, 5.1, 5.3. The mean is 5.058 and the sample standard deviation is 0.2109. The values sit in a tight, roughly symmetric band. Run all three tests and every one returns a large p-value, so nothing here contradicts normality. That is the calm case. The interesting work starts when the tests disagree.
Why three tests instead of one
Each test is sensitive to a different kind of departure, so running all three gives you a fuller picture than any single number.
- Shapiro–Wilk
- Compares the ordered sample to the values you would expect from a normal distribution. It is the most powerful general-purpose test for small to moderate samples (roughly n \le 5000) and reacts to a wide range of shapes.
- D'Agostino (K²)
- Combines a skewness test and a kurtosis test into one statistic. It tells you not just that the data are non-normal, but which moment is off: lopsidedness or tail weight.
- Kolmogorov–Smirnov
- Measures the largest gap between the sample's cumulative distribution and the normal one. It is the least powerful of the three against typical departures, and its p-value here is approximate because the mean and variance are estimated from the same data.
The K–S p-value shown uses estimated parameters, which biases the test toward large p-values (the Lilliefors problem). Treat K–S as a rough confirmation, not the deciding vote. When the tests disagree, trust Shapiro–Wilk and look at the histogram.
The math, with intuition
The Shapiro–Wilk statistic W is a squared correlation between your sorted data and the expected normal order statistics:
Here x_{(i)} is the i-th smallest value, \bar{x} is the mean, and the a_i are constants derived from the covariance of normal order statistics. When the sorted data line up perfectly with the normal template, W approaches 1. Values well below 1 signal a departure. A small p-value follows from a small W.
D'Agostino works from the standardized third and fourth moments. Sample skewness and kurtosis are:
A normal distribution has g_1 = 0 (no lean) and g_2 = 0 (the -3 makes normal the zero point, so this is excess kurtosis). Each is transformed to an approximately standard normal Z score, and the two are squared and summed:
Under normality K^2 follows a chi-square distribution with 2 degrees of freedom. If you already have a statistic in hand, the P-value calculator will turn it into a p-value.
The Kolmogorov–Smirnov statistic is the largest vertical distance between the empirical CDF F_n(x) and the fitted normal CDF F(x):
A value near 0 means the two curves track each other closely.
Worked example with the demo data
Twelve fill weights
Use the demo data: 4.8, 5.1, 5.3, 4.9, 5.0, 5.2, 4.7, 5.4, 5.0, 4.9, 5.1, 5.3.
- Mean: \bar{x} = 60.7 / 12 = 5.058.
- Sum of squared deviations: \sum (x_i - \bar{x})^2 = 0.4892, so the sample variance is
0.04447and the standard deviation is0.2109. - Skewness: g_1 = -0.087. The data lean very slightly left, essentially symmetric.
- Excess kurtosis: g_2 = -0.997. The distribution is a touch flat compared to normal, which is common in a small sample.
- Shapiro–Wilk: W = 0.968, p-value \approx 0.88.
- D'Agostino: with only 12 points the moment-based Z transforms are unstable, but the combined K^2 stays small and its p-value is well above
0.1. - Kolmogorov–Smirnov: D \approx 0.13, p-value large.
Every test fails to reject normality. The verdict for each is "no evidence against normal," which is the answer you want before running a t-test on these weights.
Reading and interpreting the results
Set your threshold before you look, usually \alpha = 0.05. Then read each row like this:
- p-value above 0.05: no evidence against normality. Proceed with normal-based methods.
- p-value below 0.05: evidence against normality. Look at the histogram, the skewness and the kurtosis to see what kind of departure you have.
When D'Agostino flags a problem, its two pieces localize it. Large positive skewness (say g_1 = 1.4) points to a right tail, common in income or waiting times. Large positive excess kurtosis (say g_2 = 3) points to heavy tails or outliers. Negative excess kurtosis points to a flat, spread-out shape.
Sample size drives the whole story. With n = 12 the tests can miss a real departure; with n = 50000 they flag a departure so small it does not matter for any practical model. Always read the p-value next to the histogram and the effect size, never alone.
Watch how sample size changes the verdict
The single most misunderstood fact about these tests is that power grows with n. A distribution that is 5% skewed passes at n = 30 and fails at n = 5000, even though the shape has not changed.
Common mistakes
Treating a large p-value as proof of normality. Failing to reject the null is weak evidence, especially at small n. At n = 12 a moderately skewed distribution can still produce a Shapiro–Wilk p-value of 0.4.
Testing the raw data when the model cares about residuals. In regression and ANOVA, the normality assumption is about the residuals, not the raw response. Fit the model first, then test the residuals.
Rejecting a good analysis over a large-sample flag. With n = 50000 a p-value of 0.001 can accompany a skewness of only 0.05. The t-test and the mean are perfectly usable there. The Central Limit Theorem protects the sampling distribution of the mean long before the raw data look normal.
Using K–S as the decider. Its estimated-parameter p-value is biased high, so it under-rejects. If K–S says "fine" while Shapiro–Wilk says "not fine," believe Shapiro–Wilk.
What to do when the data are not normal
A failed test is a routing decision, not a dead end. If the departure is mild and n is large, the mean-based tests often still hold. If it is severe, switch to a method that does not assume normality.
- Comparing two independent groups: use the Mann-Whitney U test instead of a two-sample t-test.
- Paired measurements: use the Wilcoxon signed-rank test.
- Three or more groups: use the Kruskal-Wallis H test in place of one-way ANOVA.
If the data are close enough to normal, run the parametric test you planned: a t-test for one or two means. Before an ANOVA or a pooled t-test, also check the equal-variance assumption with Levene's test. Normality is only one of the assumptions.
Frequently asked questions
Which normality test should I trust most?
For samples up to a few thousand, Shapiro–Wilk is the most reliable single test. D'Agostino adds useful detail by separating skewness from kurtosis. Kolmogorov–Smirnov is the weakest here and its p-value is only approximate, so use it as a secondary check.
My three tests disagree. What now?
Look at the histogram, the skewness and the kurtosis. Disagreement usually means the departure is borderline. Favor Shapiro–Wilk, and let the size of the skewness and kurtosis, not the p-values, guide whether the departure matters for your analysis.
How much data do I need?
Below about n = 20 the tests have little power and rarely reject even clearly non-normal data. From roughly n = 30 to n = 300 they behave sensibly. Above a few thousand they flag departures too small to affect a t-test, so lean on the histogram.
Does the mean have to be normal, or the data?
For a test of the mean, what matters is the sampling distribution of the mean, which becomes approximately normal as n grows regardless of the raw shape. That is why large samples tolerate non-normal data. Small samples do not have this protection, so normality of the raw data matters more there.
Can I use these tests on counts or proportions?
Not usefully. Count and proportion data are discrete and bounded, so they are not normal by construction. Use tools built for them, such as the Chi-square goodness-of-fit test or the One-proportion z-test.
Related tools

Chi-Square Test of Independence
Test association between two categorical variables from a contingency table.

One-Way ANOVA Calculator
Compare the means of three or more groups with an F-test.
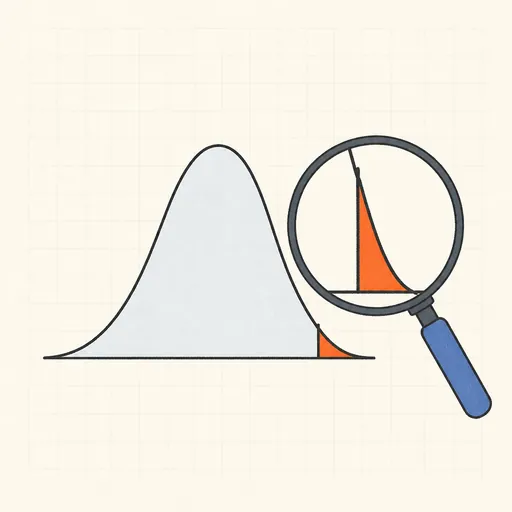
P-value Calculator
Convert z, t, χ² or F statistics into p-values.
t-Test Calculator
One-sample, two-sample (pooled/Welch) and paired t-tests from raw data.
A/B Test Significance Calculator
Two-proportion z-test with p-values, uplift and CI of the difference.

Chi-Square Goodness-of-Fit Test
Test whether observed counts match an expected distribution.