One-Way ANOVA, Explained
After reading this you can run a one-way ANOVA on three or more groups, compute the F statistic and its p-value by hand, and know when the test is trustworthy and when to reach for something else.
What one-way ANOVA does
One-way ANOVA compares the means of three or more independent groups using a single F-test. Instead of running many separate t-tests, you ask one question: are all the group means equal, or does at least one differ?
Here is a quick hook. Suppose you measure test scores under three teaching methods and get means of 71.25, 77.25 and 86. The gaps look real, but small samples wander. ANOVA answers whether the spread between those group means is large compared to the ordinary variation inside each group. If the between-group spread dwarfs the within-group noise, the F statistic is large and the p-value is small.
The name is literal. You analyse variance to draw a conclusion about means. That works because the variance of the group means, when the null hypothesis is true, tracks the pooled within-group variance in a predictable way.
When to use it, and when not to
Reach for one-way ANOVA when you have one categorical grouping factor with three or more levels and a numeric outcome measured on independent units. Comparing yields across four fertilisers, or reaction times across three age bands, both fit.
With exactly two groups, ANOVA is equivalent to a two-sample t-test: the F statistic equals the square of the t statistic, and the p-values match. Use the t-Test Calculator there, since it also reports the direction of the difference.
ANOVA assumes roughly normal residuals and equal variances across groups. If group spreads differ a lot, or the data are heavily skewed or ordinal, the F-test can mislead. Check variance with Levene's Test and shape with the Normality Test Battery. When assumptions fail, use the Kruskal-Wallis H Test, the rank-based counterpart.
ANOVA also tells you only that a difference exists somewhere. It does not say which groups differ. For that you follow up with pairwise comparisons and a correction for multiple testing.
The formula and the intuition
Write k for the number of groups and N for the total sample size. ANOVA splits the total variation in the data into two parts: variation between group means and variation within groups.
Here n_j is the size of group j, \bar{x}_j its mean, and \bar{x} the grand mean of all values pooled together. This sum grows when group means sit far from the overall mean.
This is the leftover scatter of each observation around its own group mean. Divide each sum of squares by its degrees of freedom to get a mean square: df_{\text{between}} = k - 1 and df_{\text{within}} = N - k.
If the null hypothesis is true, both mean squares estimate the same underlying variance, so F sits near 1. When group means genuinely differ, the numerator inflates and F climbs above 1. You compare the observed F to an F distribution with (k-1, N-k) degrees of freedom to get a p-value.
A worked example with the demo data
Three groups of four scores
Use the demo data: group A 68, 72, 75, 70, group B 74, 78, 80, 77, group C 85, 88, 84, 87. Each group has n_j = 4, so N = 12 and k = 3.
- Group means: \bar{x}_A = 71.25, \bar{x}_B = 77.25, \bar{x}_C = 86.
- Grand mean: \bar{x} = (71.25 + 77.25 + 86)/3 = 78.1667.
- Between-group sum of squares: 4[(71.25-78.1667)^2 + (77.25-78.1667)^2 + (86-78.1667)^2] = 4(47.84 + 0.84 + 61.36) = 440.17.
- Within-group sum of squares. Group A deviations give
26.75, group B gives18.75, group C gives10.00, so SS_{\text{within}} = 55.5. - Mean squares: MS_{\text{between}} = 440.17/2 = 220.08 and MS_{\text{within}} = 55.5/9 = 6.167.
- F statistic: F = 220.08 / 6.167 = 35.69 on (2, 9) degrees of freedom.
That F gives a p-value of about 0.00005, far below 0.05. The three teaching methods do not share a common mean.
| Source | SS | df | MS | F | p |
|---|---|---|---|---|---|
| Between | 440.2 | 2 | 220.1 | 35.69 | 0.00005 |
| Within | 55.5 | 9 | 6.167 | ||
| Total | 495.7 | 11 |
Reading the results and the effect size
The p-value answers the yes/no question. A small F on (2, 9) degrees of freedom, say 1.5, would give a p-value near 0.28 and you would not reject the null. Our F of 35.69 lands in the far tail.
Statistical significance is not the same as size of effect. Report \eta^2 (eta squared), the share of total variation explained by the grouping.
So about 89% of the variation in scores is attributable to teaching method. Rough conventions call 0.01 small, 0.06 medium and 0.14 large, so this is a very strong effect. With large samples a tiny \eta^2 can still be significant, which is why you report both numbers.
If you already have an F statistic and its degrees of freedom from another source, you can convert it to a p-value directly with the P-value Calculator.
See how F reacts to separation and noise
The F statistic is a ratio, so it responds to two things at once: how far apart the means are and how noisy each group is. Move one and watch the other lose importance.
Common mistakes
Running many t-tests instead of one ANOVA inflates the false-positive rate. With three groups you have three pairwise tests; at \alpha = 0.05 each, the chance of at least one false alarm rises to about 1 - 0.95^3 = 0.143. ANOVA keeps the overall rate at 0.05.
Treating a significant F as an answer to "which groups differ" is the second trap. It is an omnibus test. Follow up with Tukey's HSD or Bonferroni-corrected comparisons.
Ignoring unequal variances is the third. When the largest group variance is more than about four times the smallest, the standard F-test loses accuracy. A Welch ANOVA handles that case. Confirm the assumption first with Levene's Test.
Finally, do not feed in paired or repeated measurements as if they were independent groups. Measuring the same 10 people under three conditions violates the independence assumption and calls for a repeated-measures design.
Related tools
For two groups, use the t-Test Calculator. When the equal-variance or normality assumptions fail, switch to the Kruskal-Wallis H Test for three or more groups or the Mann-Whitney U Test for two. Check assumptions with Levene's Test and the Normality Test Battery. For categorical outcomes rather than numeric ones, see the Chi-Square Test of Independence or, for comparing two rates, the A/B Test Significance Calculator.
Frequently asked questions
What is a good F value for ANOVA?
There is no universal cutoff, because the threshold depends on your degrees of freedom. For (2, 9) df the 5% critical value is about 4.26; for (3, 40) df it is about 2.84. Compare your F to the p-value rather than to a fixed number.
Do the groups need equal sample sizes?
No. The formula uses each n_j as a weight, so unequal sizes are fine. Equal sizes make the test more robust to mild violations of the equal-variance assumption, but they are not required.
How is η² different from the p-value?
The p-value measures how surprising your data are under the null hypothesis. \eta^2 measures how much of the variation the grouping explains, from 0 to 1. A result can be significant yet explain very little, so report both.
What do I do after a significant ANOVA?
Run pairwise post-hoc comparisons, such as Tukey's HSD, to find which specific group pairs differ, and adjust for the number of comparisons so your overall error rate stays near 0.05.
Can I run ANOVA on just two groups?
You can, and it gives the same p-value as a pooled two-sample t-test, with F = t^2. The t-test is usually preferred there because it also reports the sign of the difference and a confidence interval.
Related tools

Chi-Square Test of Independence
Test association between two categorical variables from a contingency table.
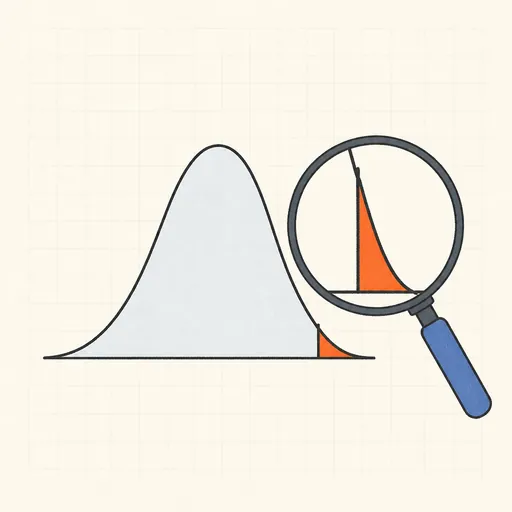
P-value Calculator
Convert z, t, χ² or F statistics into p-values.
t-Test Calculator
One-sample, two-sample (pooled/Welch) and paired t-tests from raw data.
A/B Test Significance Calculator
Two-proportion z-test with p-values, uplift and CI of the difference.

Chi-Square Goodness-of-Fit Test
Test whether observed counts match an expected distribution.
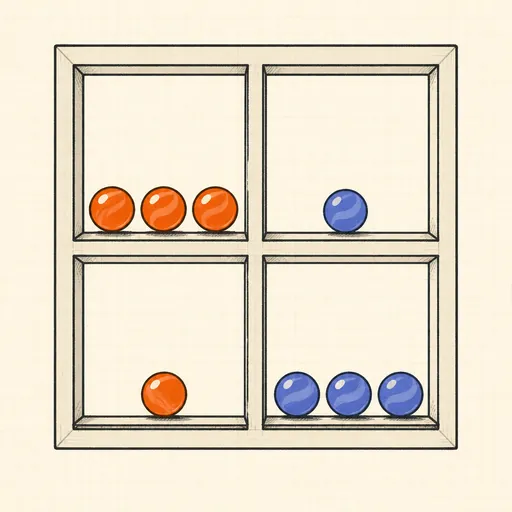
Fisher's Exact Test
Exact test for association in a 2×2 table — reliable for small counts.