Punnett Squares, Explained
After reading this you can build a Punnett square for a monohybrid or dihybrid cross by hand, count the genotype and phenotype ratios, and know exactly which assumptions those ratios depend on.
A Punnett square is a bookkeeping grid. It lists the gametes one parent can produce along the top, the gametes the other parent can produce down the side, and fills each cell with the offspring genotype formed by combining the two. Reginald Punnett drew the first one around 1905 to make Mendel's ratios visible. The grid does no biology on its own. It just organizes the possible combinations so you can count them.
Here is the hook. Cross two heterozygous pea plants, Aa by Aa, where A makes purple flowers and a makes white. Roughly three quarters of the offspring flower purple and one quarter flower white. That 3:1 split is not a rule you memorize. It falls straight out of counting four equally likely cells, and you can rederive it in about thirty seconds.
What the square actually counts
Each parent carries two alleles at a gene and passes exactly one to each offspring. Which allele passes is a coin flip: a heterozygous Aa parent produces A gametes half the time and a gametes half the time. Fertilization pairs one gamete from each parent, so an offspring genotype is a pair drawn independently from the two parents.
The square lays out every pairing. For a single gene each parent has at most two distinct gametes, so the grid is 2 by 2 with four cells. Each cell has equal probability \frac{1}{4} because each gamete is equally likely and the two draws are independent. Counting the cells gives you the genotype ratio directly.
The square is a probability table in disguise. A 2 by 2 grid encodes the product of two coin flips. A 4 by 4 grid for a dihybrid cross encodes the product of four flips. Every ratio you read off is really a count of equally likely outcomes.
When to use it, and when not to
Use a Punnett square when you have a small number of genes, each with clear dominant and recessive alleles, and you want the probability distribution of offspring from a single cross. It is exact for one gene (monohybrid) and two genes (dihybrid) and stays readable up to maybe three genes, where the grid becomes 8 by 8 with 64 cells.
Stop using it when the grid stops being the right model. If you want allele and genotype frequencies across a whole breeding population rather than a single mating, use the Hardy-Weinberg Equilibrium Calculator instead. The square handles one cross; Hardy-Weinberg handles the gene pool.
The square also breaks when the simple dominant-recessive picture fails. Incomplete dominance, codominance, multiple alleles, sex linkage, and epistasis all change how genotypes map to phenotypes. You can still build the genotype grid, but the phenotype counting changes. And the clean 9:3:3:1 dihybrid ratio assumes the two genes assort independently, which fails when they sit close together on the same chromosome and travel together during meiosis.
The math behind the ratios
For a single gene, the genotype probabilities are the product of the parents' gamete probabilities. Write the fraction of A gametes from parent 1 as p_1 and from parent 2 as p_2. Then:
Here P(AA) is the chance an offspring gets A from both parents, P(aa) the chance it gets a from both, and P(Aa) the chance it gets one of each, which can happen two ways. For a heterozygous cross p_1 = p_2 = \frac{1}{2}, so P(AA) = \frac{1}{4}, P(Aa) = \frac{1}{2}, and P(aa) = \frac{1}{4}: the 1:2:1 genotype ratio.
Because A is dominant, both AA and Aa show the dominant phenotype. Add their probabilities: \frac{1}{4} + \frac{1}{2} = \frac{3}{4} dominant against \frac{1}{4} recessive. That is the 3:1 phenotype ratio.
For two independent genes, multiply the single-gene distributions. The dihybrid phenotype fractions are the product of two 3:1 splits:
Each term is a phenotype class. \frac{9}{16} show both dominant traits, the two \frac{3}{16} terms show one dominant and one recessive, and \frac{1}{16} show both recessive. That is the 9:3:3:1 ratio, and it is just the product of two coins, not a separate law to memorize.
Worked example: AaBb × AaBb
Reproducing the demo cross
Enter AaBb for both parents, the demo values, and work it by hand to check.
- List the gametes. A parent that is
AaBbproduces four gamete types with equal probability, one from each allele combination:AB,Ab,aB,ab, each \frac{1}{4}. - Build the grid. Both parents give the same four gametes, so the square is 4 by 4 with 16 cells, each cell probability \frac{1}{16}.
- Count the phenotype classes. Sort each of the 16 offspring by whether it carries at least one dominant allele at each gene.
- Tally: 9 cells show both dominant (
A_B_), 3 show dominant A and recessive b (A_bb), 3 show recessive a and dominant B (aaB_), 1 shows both recessive (aabb).
The phenotype ratio is 9:3:3:1. If you raise 320 offspring, expect about 320 \times \frac{9}{16} = 180 both-dominant, 320 \times \frac{3}{16} = 60 in each single-recessive class, and 320 \times \frac{1}{16} = 20 double-recessive.
Reading and interpreting the ratios
Two ratios come out of any cross, and they are not the same. The genotype ratio counts the actual allele pairs. For Aa × Aa it is 1 AA : 2 Aa : 1 aa. The phenotype ratio counts the visible traits after applying dominance, which collapses AA and Aa into one class and gives 3:1.
Read these as probabilities for each offspring, not guarantees for a litter. A 3:1 ratio means each individual offspring has probability \frac{3}{4} of the dominant phenotype. A litter of four can easily come out 4:0 or 2:2. The ratios are expected values that tighten as the number of offspring grows.
Common mistakes
The most frequent error is confusing the two ratios. When someone says "the cross gives 3:1," they mean phenotype. The genotype ratio for the same cross is 1:2:1. Always state which one you mean.
The second error is assuming independent assortment when the genes are linked. The 9:3:3:1 ratio requires that the allele you inherit at gene A tells you nothing about the allele at gene B. Two genes close together on the same chromosome violate this, and the real offspring counts skew toward parental combinations. If your observed dihybrid data are far from 9:3:3:1, suspect linkage before you suspect a counting error.
Do not read a small litter as a failed prediction. Expected 3:1 in eight offspring means 6 and 2 on average, but 5:3 and 7:1 are both common by chance. Ratios describe probabilities per offspring, and only large samples land near the clean fraction.
A third error is mislabeling gametes for a dihybrid parent. An AaBb parent gives four gamete types, not two. Forgetting the Ab and aB recombinant gametes shrinks your grid and produces wrong ratios.
Related tools
Once you are comfortable with single crosses, several other calculators pick up where the square stops. The Hardy-Weinberg Equilibrium Calculator extends allele counting from one mating to a whole population. If your genetics work involves the underlying sequence, the DNA & RNA Sequence Toolkit handles complement, transcription, translation and GC content. For population dynamics in microbes, the Bacterial Growth Calculator projects cell counts from doubling time. And for enzyme reaction rates, the Michaelis-Menten Kinetics Calculator takes over.
Frequently asked questions
What is the difference between genotype ratio and phenotype ratio?
The genotype ratio counts allele pairs, like 1 AA : 2 Aa : 1 aa. The phenotype ratio counts visible traits after dominance folds AA and Aa together, giving 3:1. Same cross, two different countings.
Why is a monohybrid cross always 3:1?
Only for Aa × Aa. Both parents give A and a gametes with equal chance, so the four cells are AA, Aa, Aa, aa. Three carry a dominant allele, one does not. Change either parent's genotype and the ratio changes.
How do I do a testcross?
Cross the individual of unknown genotype with a homozygous recessive aa partner. If the mystery parent is AA, all offspring show the dominant trait. If it is Aa, about half show the recessive trait. The offspring ratio reveals the hidden allele.
Can I use a Punnett square for three genes?
Yes, but the grid is 8 by 8 with 64 cells for a trihybrid cross. It works if the genes assort independently. Beyond three genes the grid becomes unwieldy and multiplying single-gene probabilities is faster.
Why do my real offspring counts not match the predicted ratio?
Small sample size is the usual reason: 20 offspring rarely land exactly on 9:3:3:1. Persistent large deviations point to linked genes, incomplete dominance, or a lethal genotype removing one class before you count.
Related tools

Aquarium Stocking & Cycling Calculator
Bioload-based stocking level and a fishless cycling plan.
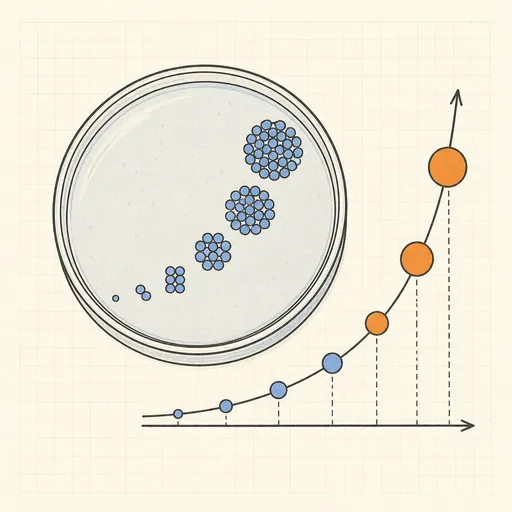
Bacterial Growth Calculator
Population from doubling time and elapsed time.
DNA & RNA Sequence Toolkit
Complement, transcription, translation and GC content.
Hardy-Weinberg Equilibrium Calculator
Allele and genotype frequencies in a population.
Michaelis-Menten Kinetics Calculator
Enzyme reaction rate from Vmax, Km and [S].
Chemical Equation Balancer
Balance any chemical equation to whole numbers.